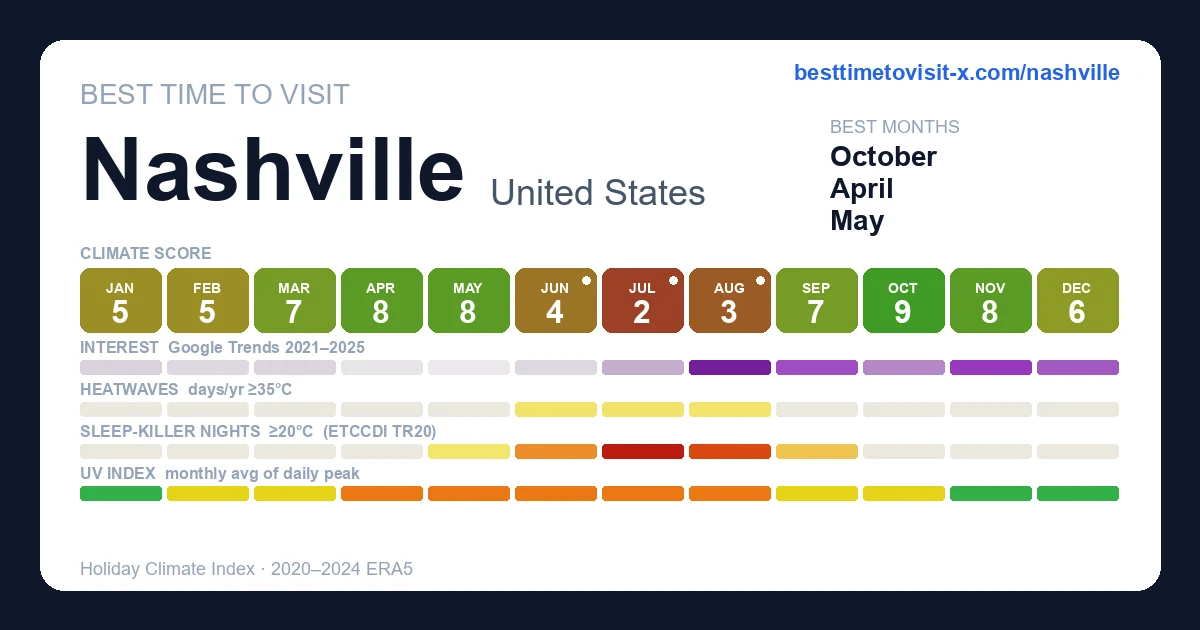
Best time to visit Nashville
Re-score for me — drag the dial — every chart on the page recolours live for your heat limit 27°C
Default 27 °C is the upper edge of the Holiday Climate Index "ideal comfort" band (Scott, Rutty, Amelung & Tang, 2016). Above this, most warm-tourism travellers report measurable discomfort.
Greyed factors are scored normally — extreme heat overrides them, so a clear sky or low rain can't lift the period.
Greyed factors are scored normally — extreme heat overrides them, so a clear sky or low rain can't lift the period.
Greyed factors are scored normally — extreme heat overrides them, so a clear sky or low rain can't lift the period.
Greyed factors are scored normally — extreme heat overrides them, so a clear sky or low rain can't lift the period.
Greyed factors are scored normally — extreme heat overrides them, so a clear sky or low rain can't lift the period.
Greyed factors are scored normally — extreme heat overrides them, so a clear sky or low rain can't lift the period.
Greyed factors are scored normally — extreme heat overrides them, so a clear sky or low rain can't lift the period.
Greyed factors are scored normally — extreme heat overrides them, so a clear sky or low rain can't lift the period.
Greyed factors are scored normally — extreme heat overrides them, so a clear sky or low rain can't lift the period.
Greyed factors are scored normally — extreme heat overrides them, so a clear sky or low rain can't lift the period.
Greyed factors are scored normally — extreme heat overrides them, so a clear sky or low rain can't lift the period.
Greyed factors are scored normally — extreme heat overrides them, so a clear sky or low rain can't lift the period.
Greyed factors are scored normally — extreme heat overrides them, so a clear sky or low rain can't lift the period.
Greyed factors are scored normally — extreme heat overrides them, so a clear sky or low rain can't lift the period.
Greyed factors are scored normally — extreme heat overrides them, so a clear sky or low rain can't lift the period.
Greyed factors are scored normally — extreme heat overrides them, so a clear sky or low rain can't lift the period.
Greyed factors are scored normally — extreme heat overrides them, so a clear sky or low rain can't lift the period.
Greyed factors are scored normally — extreme heat overrides them, so a clear sky or low rain can't lift the period.
Greyed factors are scored normally — extreme heat overrides them, so a clear sky or low rain can't lift the period.
Greyed factors are scored normally — extreme heat overrides them, so a clear sky or low rain can't lift the period.
Greyed factors are scored normally — extreme heat overrides them, so a clear sky or low rain can't lift the period.
Greyed factors are scored normally — extreme heat overrides them, so a clear sky or low rain can't lift the period.
Greyed factors are scored normally — extreme heat overrides them, so a clear sky or low rain can't lift the period.
Greyed factors are scored normally — extreme heat overrides them, so a clear sky or low rain can't lift the period.
Greyed factors are scored normally — extreme heat overrides them, so a clear sky or low rain can't lift the period.
Greyed factors are scored normally — extreme heat overrides them, so a clear sky or low rain can't lift the period.
Greyed factors are scored normally — extreme heat overrides them, so a clear sky or low rain can't lift the period.
How is this scored? HCI / Steadman / CCI gate — full methodology and citations below.
Compare with another destination
Add as many as you like — stacked below the main strips above. Each row is just the recent-window score strip and (for beach destinations) sea-temperature strip.
Tours in Nashville
26 top-rated tours via Viator. Booking links earn this site a commission at no cost to you.
- 1
 Nashville's Wildest Honky Tonk Public Party Bus (21+)
 - 2
 Murals of Nashville Instagram Tour by Golf Cart
 - 3
 Walking Food & Drink Tour of Downtown Nashville
 - 4
 Guided Segway Tour of Downtown Nashville
 - 5
 Nashville Combo Tour: Sightseeing, Murals & Brewery/Distillery
 - 6
 Nashville Rollin Jamboree Comedy & Country Music Sing-Along Tour
 - 7
 Open-Air Minibus Sightseeing Tour of Nashville
 - 8
 Nashville's Wildest Honky Tonk on Wheels Private Party Bus
 - 9
 Best of Nashville City Sightseeing Tour on Double Decker Bus
 - 10
 Nashville to Jack Daniel's Distillery Bus Tour + Whiskey Tastings
 - 11
 Explore the City of Nashville Sightseeing Tour by Golf Cart
 - 12
 Nashville Brewery & Distillery Tour by Golf Cart
 - 13
 Guided Pub Crawl Walking Tour of Downtown Nashville
 - 14
 Nashville Unveiled: The History, Music, and Hacks Tour!
 - 15
 Beginner's Line Dancing Class with Instructor in Nashville
 - 16
 Downtown Nashville's Hidden Gems E-bike Tour
 - 17
 Uncle Nearest Distillery Bus Tour with Tastings from Nashville
 - 18
 Nashville Mural Photowalk Tour with Professional Photographer
 - 19
 Eastside Electric Bike, Brew & BBQ Tour
 - 20
 Downtown Nashville Shopping Tour by Golf Cart
 - 21
 Taste of Nashville Food & Sightseeing Tour
 - 22
 Nashville: Food Tour with 5+ Tastings of Local Delicacies
 - 23
 Nashville RCA Studio B & Country Music Hall of Fame Ticket Combo
 - 24
 Helicopter Tour of Downtown Nashville
 - 25
 Nashville 12South District Authentic Food Tour with 7 Tastings
 - 26
 Adventureworks Ziplines at Nashville West
Last refreshed 2026-05-25.
Similar climatesAtlanta94% · Raleigh93% · Williamsburg93%
Other destinations with the most-alike year-round climate to Nashville (apparent temperature, rain hours, sunshine — matched within the same trip-profile). The ±N chip compares each match's typical score for the current month against Nashville's. Based on the 2020-2024 climatology, not this year's actual weather.
Month-by-month
| Month | Temp °C | Feels °C | Rain days | Rain h | Rain h/day | Humidity | Wind km/h | Sun h | UV | Interest | Score |
|---|---|---|---|---|---|---|---|---|---|---|---|
| Jan | 0–9 | 6 | 13 | 148 | 11.4 | 66% | 18 | 140 | 2 | Quiet | 5 |
| Feb | 2–12 | 9 | 12 | 134 | 11.2 | 62% | 18 | 132 | 3 | Quiet | 5 |
| Mar | 6–17 | 15 | 14 | 123 | 8.8 | 60% | 19 | 183 | 5 | Quiet | 7 |
| Apr | 9–20 | 18 | 12 | 112 | 9.3 | 56% | 19 | 216 | 6 | Quiet | 8 |
| May | 15–26 | 26 | 13 | 141 | 10.8 | 59% | 16 | 243 | 6 | Quiet | 8 |
| Jun | 19–30 | 33 | 13 | 127 | 9.8 | 55% | 15 | 266 | 7 | Quiet | 4 |
| Jul | 22–32 | 36 | 17 | 173 | 10.2 | 63% | 13 | 266 | 8 | Quiet | 2 |
| Aug | 21–30 | 34 | 16 | 178 | 11.1 | 64% | 12 | 247 | 7 | Peak | 3 |
| Sep | 17–27 | 29 | 11 | 121 | 11.0 | 60% | 13 | 217 | 6 | Busy | 7 |
| Oct | 12–23 | 22 | 8 | 95 | 11.9 | 56% | 15 | 207 | 5 | Moderate | 9 |
| Nov | 6–16 | 14 | 8 | 74 | 9.3 | 59% | 16 | 170 | 3 | Busy | 8 |
| Dec | 3–12 | 9 | 11 | 115 | 10.5 | 66% | 18 | 140 | 2 | Busy | 6 |
UV Index in Nashville by Month
UV index in Nashville peaks at 8 (high) in July, dropping to 2 (low) in December. April, May, June, July, August have high UV — SPF 30+ and sunglasses recommended.
Best months in detail
October
9/1012–23°C · 8 rain days (95h) · 207 sun hours · 56% humidity · Moderate crowd · UV 5 (moderate)
April
8/109–20°C (feels 18°C) · 12 rain days (112h) · 216 sun hours · 56% humidity · Quiet crowd · UV 6 (high) · sunniest 1 in 10 days reach 8 (high)
May
8/1015–26°C · 13 rain days (141h) · 243 sun hours · 59% humidity · Quiet crowd · UV 6 (high) · sunniest 1 in 10 days reach 8 (very high)
Every month
Show the other 9 months in detail
January
5/100–9°C (feels 6°C) · 13 rain days (148h) · 140 sun hours · 66% humidity · Quiet crowd · UV 2 (low) · sunniest 1 in 10 days reach 3 (moderate)
February
5/102–12°C (feels 9°C) · 12 rain days (134h) · 132 sun hours · 62% humidity · Quiet crowd · UV 3 (moderate)
March
7/106–17°C (feels 15°C) · 14 rain days (123h) · 183 sun hours · 60% humidity · Quiet crowd · UV 5 (moderate) · sunniest 1 in 10 days reach 7 (high)
June
4/1019–30°C (feels 33°C) · 13 rain days (127h) · 266 sun hours · 55% humidity · Quiet crowd · UV 7 (high) · sunniest 1 in 10 days reach 9 (very high)
July
2/1022–32°C (feels 36°C) · 17 rain days (173h) · 266 sun hours · 63% humidity · Quiet crowd · UV 8 (high) · sunniest 1 in 10 days reach 9 (very high)
August
3/1021–30°C (feels 34°C) · 16 rain days (178h) · 247 sun hours · 64% humidity · Peak crowd · UV 7 (high) · sunniest 1 in 10 days reach 9 (very high)
September
7/1017–27°C (feels 29°C) · 11 rain days (121h) · 217 sun hours · 60% humidity · Busy crowd · UV 6 (moderate) · sunniest 1 in 10 days reach 7 (high)
November
8/106–16°C (feels 14°C) · 8 rain days (74h) · 170 sun hours · 59% humidity · Busy crowd · UV 3 (low) · sunniest 1 in 10 days reach 4 (moderate)
December
6/103–12°C (feels 9°C) · 11 rain days (115h) · 140 sun hours · 66% humidity · Busy crowd · UV 2 (low)
Comparisons people search for
Pairs validated by Google Autocomplete demand — only pairs people actually compare.
Frequently asked questions about visiting Nashville
When is the best time to visit Nashville?
October is the highest-scoring month (9/10 on the Holiday Climate Index). Typical conditions: 12–23°C (8 rainy days). The top three months by score are October, April, May.
What is the worst time to visit Nashville?
July is the lowest-scoring month (2/10, capped by extreme heat). Typical conditions: 22–32°C (17 rainy days).
Is Nashville too hot in summer?
3 months (June, July, August) trip the heat deal-breaker in our scoring: apparent temperature crosses the comfort cap, so even with clear skies and low rain the score is held down. Plan around it if heat tolerance is low.
When are crowds lowest in Nashville?
Search-interest seasonality (Google Trends 2021-2025) is lowest in May and peaks in August. Interest tracks both in-trip visitors and lead-time planners, so treat it as a "destination is on people's minds" signal rather than literal arrivals.
Which months in Nashville have good weather but fewer tourists?
October (climate 9/10, crowd index 47) and April (climate 8/10, crowd index 2) — shoulder months with above-average climate and below-median search-interest. Often the best value-for-weather trade.
What is the UV index in Nashville by month?
UV peaks at 8 (high) in July and is lowest in December at 2 (low). Monthly peak values: Jan 2, Feb 3, Mar 5, Apr 6, May 6, Jun 7, Jul 8, Aug 7, Sep 6, Oct 5, Nov 3, Dec 2.
What is the UV index in Nashville in July?
July is the peak UV month in Nashville, with a daily-peak UV index of 8 (high). Apply SPF 30+, wear sunglasses, and seek shade during midday hours.
How high can UV get in Nashville on the sunniest days?
Most days look like the monthly average, but on the sunniest ~1 in 10 days UV climbs higher than the mean suggests. July is the worst case: typical days average UV 8 (high), but the top 10% of days reach UV 9 (very high) — and even higher. Months where the sunniest days routinely exceed the typical reading: January, March, April, May, June, July, August, September, November. Plan sun protection for the worst case, not the average.
Is air quality in Nashville bad for travelers?
PM2.5 (fine-particle pollution) exceeds the WHO sensitive-group guideline (15 µg/m³) in 5 months: May, June, July, August, September. The worst month is June with a typical-day mean of 14 µg/m³ (moderate); on the worst 10% of days PM2.5 reaches 24 µg/m³ (unhealthy for sensitive) and higher. People with asthma, heart conditions, or sensitive children may want to avoid these months or limit outdoor activity. Source: CAMS via Open-Meteo.