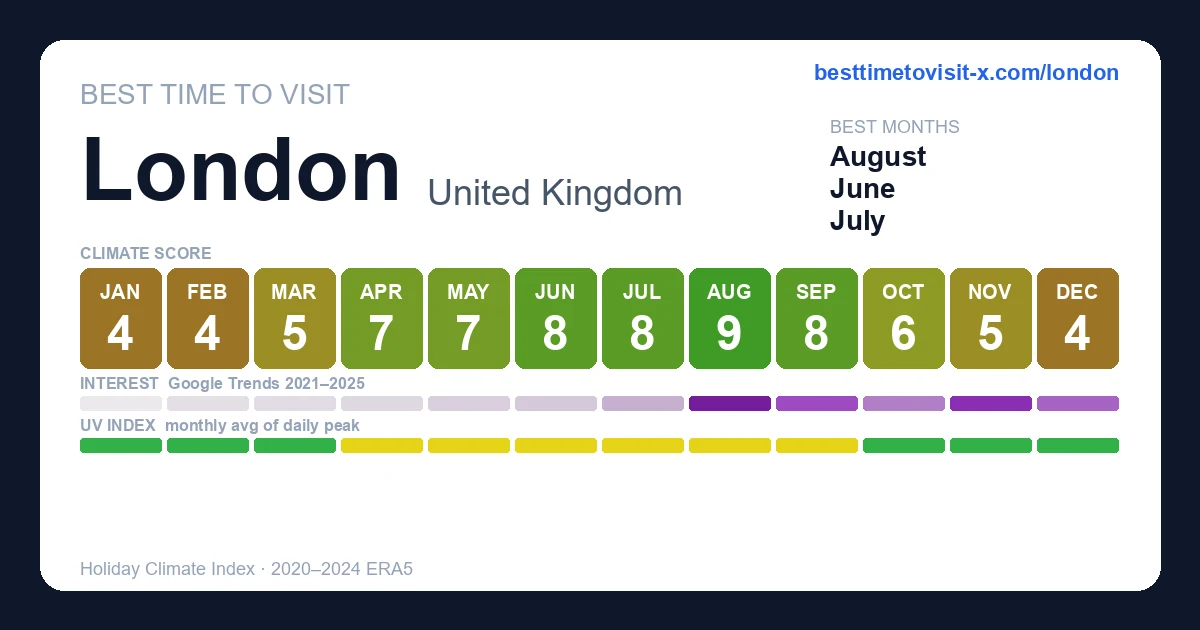
Best time to visit London
Re-score for me — drag the dial — every chart on the page recolours live for your heat limit 27°C
Default 27 °C is the upper edge of the Holiday Climate Index "ideal comfort" band (Scott, Rutty, Amelung & Tang, 2016). Above this, most warm-tourism travellers report measurable discomfort.
How is this scored? HCI / Steadman / CCI gate — full methodology and citations below.
Compare with another destination
Add as many as you like — stacked below the main strips above. Each row is just the recent-window score strip and (for beach destinations) sea-temperature strip.
Tours in London
29 top-rated tours via Viator. Booking links earn this site a commission at no cost to you.
- 1
 Stonehenge Inner Circle Access Day Trip from London Including Windsor
 - 2
 Westminster Abbey, Big Ben, Buckingham Guided Tour of London
 - 3
 Ultimate Jack the Ripper : Guided Tour of London
 - 4
 London Best of the City Fully Customized Guided Private Tour
 - 5
 The Premier Classic London: Private 4-Hour Tour in a Black Cab
 - 6
 London Sightseeing Private Black Cab Tour with Hotel Pick Up
 - 7
 Southampton Pre-Cruise Tour: London to Southampton via Stonehenge
 - 8
 VIP Tower of London and Crown Jewels Tour with Private Beefeater Meet & Greet
 - 9
 Early Access Tower of London: Crown Jewels and Beefeater Ceremony
 - 10
 Downton Abbey & Highclere Castle Tour from London, with Oxford
 - 11
 VIP Early Access: Opening Ceremony Tower of London & Bridge Entry
 - 12
 Westminster Abbey Entrance Ticket Including Audio Guide
 - 13
 The Ultimate 6-hour Private Tour of London in an Iconic Black Cab
 - 14
 London: Buckingham Palace & Big Ben (& Westminster Abbey entry)
 - 15
 Stonehenge and Windsor from London
 - 16
 Small-Group Cotswolds Tour (From London)
 - 17
 London 30 Top Sights with Fun Local Guide
 - 18
 London in WW2 Walking Tour with Churchill War Rooms Visit
 - 19
 London Bridge & Borough Market Food Tour with 7 Authentic Dishes
 - 20
 London Small Group Tour of Historical Pubs
 - 21
 High-Speed Thames River Speedboat in London
 - 22
 London Foodie Adventure:More than 10 dishes with Sherpa Food Tour
 - 23
 Stonehenge & Bath Day Trip from London Optional Roman Baths Visit
 - 24
 Seven Sisters & South Downs Tour with Train Tickets Included
 - 25
 The Original Jack the Ripper : Guided Tour
 - 26
 Westminster Guided Walking Tour with Abbey Entry
 - 27
 Winner 2026 London East End Food Tour: 10 Year Anniversary
 - 28
 Harry Potter Warner Bros. Studio Tour with Transport from London
 - 29
 Warner Bros. Studio Harry Potter Tour with Superior Transport from London
Last refreshed 2026-05-25.
Similar climatesWindsor99% · Cambridge97% · Oxford96%
Other destinations with the most-alike year-round climate to London (apparent temperature, rain hours, sunshine — matched within the same trip-profile). The ±N chip compares each match's typical score for the current month against London's. Based on the 2020-2024 climatology, not this year's actual weather.
Month-by-month
| Month | Temp °C | Feels °C | Rain days | Rain h | Rain h/day | Humidity | Wind km/h | Sun h | UV | Interest | Score |
|---|---|---|---|---|---|---|---|---|---|---|---|
| Jan | 2–8 | 4 | 11 | 121 | 11.0 | 82% | 23 | 101 | 1 | Quiet | 4 |
| Feb | 4–10 | 6 | 13 | 133 | 10.2 | 76% | 27 | 103 | 1 | Quiet | 4 |
| Mar | 4–11 | 8 | 14 | 150 | 10.7 | 69% | 24 | 151 | 2 | Quiet | 5 |
| Apr | 5–14 | 10 | 9 | 100 | 11.1 | 58% | 22 | 218 | 3 | Quiet | 7 |
| May | 8–18 | 15 | 11 | 128 | 11.6 | 60% | 21 | 250 | 4 | Quiet | 7 |
| Jun | 12–21 | 20 | 11 | 121 | 11.0 | 57% | 20 | 265 | 5 | Quiet | 8 |
| Jul | 14–22 | 21 | 11 | 135 | 12.3 | 58% | 21 | 262 | 4 | Quiet | 8 |
| Aug | 14–23 | 22 | 8 | 102 | 12.8 | 59% | 21 | 236 | 4 | Peak | 9 |
| Sep | 12–20 | 19 | 11 | 113 | 10.3 | 64% | 20 | 194 | 3 | Busy | 8 |
| Oct | 9–16 | 14 | 16 | 155 | 9.7 | 75% | 23 | 148 | 2 | Moderate | 6 |
| Nov | 6–11 | 9 | 11 | 115 | 10.5 | 81% | 21 | 104 | 1 | Peak | 5 |
| Dec | 4–9 | 5 | 12 | 137 | 11.4 | 85% | 22 | 73 | — | Moderate | 4 |
UV Index in London by Month
UV index in London peaks at 5 (moderate) in June, dropping to 0 (low) in December.
Best months in detail
August
9/1014–23°C (feels 22°C) · 8 rain days (102h) · 236 sun hours · 59% humidity · Peak crowd · UV 4 (moderate) · sunniest 1 in 10 days reach 6 (moderate)
June
8/1012–21°C (feels 20°C) · 11 rain days (121h) · 265 sun hours · 57% humidity · Quiet crowd · UV 5 (moderate) · sunniest 1 in 10 days reach 7 (high)
July
8/1014–22°C (feels 21°C) · 11 rain days (135h) · 262 sun hours · 58% humidity · Quiet crowd · UV 4 (moderate) · sunniest 1 in 10 days reach 6 (high)
Every month
Show the other 9 months in detail
January
4/102–8°C (feels 4°C) · 11 rain days (121h) · 101 sun hours · 82% humidity · Quiet crowd · UV 1 (low)
February
4/104–10°C (feels 6°C) · 13 rain days (133h) · 103 sun hours · 76% humidity · Quiet crowd · UV 1 (low)
March
5/104–11°C (feels 8°C) · 14 rain days (150h) · 151 sun hours · 69% humidity · Quiet crowd · UV 2 (low)
April
7/105–14°C (feels 10°C) · 9 rain days (100h) · 218 sun hours · 58% humidity · Quiet crowd · UV 3 (moderate)
May
7/108–18°C (feels 15°C) · 11 rain days (128h) · 250 sun hours · 60% humidity · Quiet crowd · UV 4 (moderate) · sunniest 1 in 10 days reach 6 (moderate)
September
8/1012–20°C (feels 19°C) · 11 rain days (113h) · 194 sun hours · 64% humidity · Busy crowd · UV 3 (moderate)
October
6/109–16°C (feels 14°C) · 16 rain days (155h) · 148 sun hours · 75% humidity · Moderate crowd · UV 2 (low)
November
5/106–11°C (feels 9°C) · 11 rain days (115h) · 104 sun hours · 81% humidity · Peak crowd · UV 1 (low)
December
4/104–9°C (feels 5°C) · 12 rain days (137h) · 73 sun hours · 85% humidity · Moderate crowd
Comparisons people search for
Pairs validated by Google Autocomplete demand — only pairs people actually compare.
- London vs Edinburgh
- London vs Berlin
- London vs Chicago
- London vs Dubai
- London vs Glasgow
- London vs Tokyo
- London vs Bangkok
- London vs Beijing
- London vs Lisbon
- London vs New York City
- London vs Vancouver
- London vs Cape Town
- London vs Kyoto
- London vs Paris
- London vs Buenos Aires
- London vs Madrid
- London vs Montreal
- London vs Rome
- London vs San Francisco
- London vs Rio de Janeiro
- London vs Edmonton
- London vs Sydney
Frequently asked questions about visiting London
When is the best time to visit London?
August is the highest-scoring month (9/10 on the Holiday Climate Index). Typical conditions: 14–23°C (8 rainy days). The top three months by score are August, June, July.
What is the worst time to visit London?
December is the lowest-scoring month (4/10). Typical conditions: 4–9°C (12 rainy days).
When are crowds lowest in London?
Search-interest seasonality (Google Trends 2021-2025) is lowest in January and peaks in August. Interest tracks both in-trip visitors and lead-time planners, so treat it as a "destination is on people's minds" signal rather than literal arrivals.
Which months in London have good weather but fewer tourists?
June (climate 8/10, crowd index 18) and July (climate 8/10, crowd index 30) — shoulder months with above-average climate and below-median search-interest. Often the best value-for-weather trade.
What is the UV index in London by month?
UV peaks at 5 (moderate) in June and is lowest in December at 0 (low). Monthly peak values: Jan 1, Feb 1, Mar 2, Apr 3, May 4, Jun 5, Jul 4, Aug 4, Sep 3, Oct 2, Nov 1, Dec —.
What is the UV index in London in June?
June is the peak UV month in London, with a daily-peak UV index of 5 (moderate). Standard sun protection — sunglasses and light SPF — is recommended.
How high can UV get in London on the sunniest days?
Most days look like the monthly average, but on the sunniest ~1 in 10 days UV climbs higher than the mean suggests. June is the worst case: typical days average UV 5 (moderate), but the top 10% of days reach UV 7 (high) — and even higher. Months where the sunniest days routinely exceed the typical reading: May, June, July, August. Plan sun protection for the worst case, not the average.
Is air quality in London bad for travelers?
PM2.5 (fine-particle pollution) exceeds the WHO sensitive-group guideline (15 µg/m³) in 8 months: January, February, March, April, May, September, November, December. The worst month is March with a typical-day mean of 13 µg/m³ (moderate); on the worst 10% of days PM2.5 reaches 25 µg/m³ (unhealthy for sensitive) and higher. People with asthma, heart conditions, or sensitive children may want to avoid these months or limit outdoor activity. Source: CAMS via Open-Meteo.