Best time to visit Linz
Re-score for me — drag the dial — every chart on the page recolours live for your heat limit 27°C
Default 27 °C is the upper edge of the Holiday Climate Index "ideal comfort" band (Scott, Rutty, Amelung & Tang, 2016). Above this, most warm-tourism travellers report measurable discomfort.
How is this scored? HCI / Steadman / CCI gate — full methodology and citations below.
Compare with another destination
Add as many as you like — stacked below the main strips above. Each row is just the recent-window score strip and (for beach destinations) sea-temperature strip.
Tours in Linz
6 top-rated tours via Viator. Booking links earn this site a commission at no cost to you. Map locations are approximate (centred on Linz).
- 1
 Private Return Day Trip from Linz to Cesky Krumlov with Guided Tour
 - 2
 Private day trip from Linz to Cesky Krumlov and back
 - 3
 Linz: Pöstlingberg and Old Town Private Walking Tour
 - 4
 Linz Private Walking Tour With A Professional Guide
 - 5
 Private one way transfer from Linz to Cesky Krumlov
 - 6
 Drive to the sightseeing kites in Linz
Last refreshed 2026-06-26.
Similar climatesRegensburg95% · Stuttgart95% · Basel94%
Other destinations with the most-alike year-round climate to Linz (apparent temperature, rain hours, sunshine — matched within the same trip-profile). The ±N chip compares each match's typical score for the current month against Linz's. Based on the 2020-2024 climatology, not this year's actual weather.
Month-by-month
| Month | Temp °C | Feels °C | Rain days | Rain h | Rain h/day | Humidity | Wind km/h | Sun h | UV | Interest | Score |
|---|---|---|---|---|---|---|---|---|---|---|---|
| Jan | -2–5 | 1 | 12 | 158 | 13.2 | 77% | 17 | 96 | 1 | Quiet | 4 |
| Feb | 1–9 | 5 | 10 | 145 | 14.5 | 69% | 20 | 133 | 1 | Quiet | 5 |
| Mar | 2–12 | 8 | 10 | 105 | 10.5 | 58% | 18 | 194 | 2 | Quiet | 6 |
| Apr | 5–15 | 12 | 12 | 151 | 12.6 | 56% | 17 | 208 | 4 | Moderate | 6 |
| May | 10–19 | 18 | 15 | 165 | 11.0 | 58% | 17 | 232 | 5 | Moderate | 7 |
| Jun | 15–25 | 25 | 14 | 137 | 9.8 | 55% | 16 | 268 | 6 | Moderate | 8 |
| Jul | 16–27 | 27 | 11 | 114 | 10.4 | 52% | 16 | 278 | 6 | Peak | 9 |
| Aug | 16–26 | 27 | 14 | 154 | 11.0 | 59% | 15 | 242 | 5 | Peak | 8 |
| Sep | 13–22 | 21 | 9 | 121 | 13.4 | 62% | 15 | 207 | 4 | Busy | 8 |
| Oct | 8–16 | 15 | 10 | 110 | 11.0 | 72% | 14 | 165 | 2 | Moderate | 7 |
| Nov | 2–9 | 6 | 10 | 124 | 12.4 | 80% | 15 | 111 | 1 | Moderate | 5 |
| Dec | 0–5 | 2 | 12 | 173 | 14.4 | 82% | 16 | 87 | 1 | Quiet | 3 |
UV Index in Linz by Month
UV index in Linz peaks at 6 (moderate) in June, dropping to 1 (low) in December.
Best months in detail
July
9/1016–27°C · 11 rain days (114h) · 278 sun hours · 52% humidity · Peak crowd · UV 6 (moderate) · sunniest 1 in 10 days reach 7 (high)
September
8/1013–22°C · 9 rain days (121h) · 207 sun hours · 62% humidity · Busy crowd · UV 4 (moderate) · sunniest 1 in 10 days reach 5 (moderate)
June
8/1015–25°C · 14 rain days (137h) · 268 sun hours · 55% humidity · Moderate crowd · UV 6 (moderate) · sunniest 1 in 10 days reach 8 (high)
Every month
Show the other 9 months in detail
January
4/10-2–5°C (feels 1°C) · 12 rain days (158h) · 96 sun hours · 77% humidity · Quiet crowd · UV 1 (low)
February
5/101–9°C (feels 5°C) · 10 rain days (145h) · 133 sun hours · 69% humidity · Quiet crowd · UV 1 (low)
March
6/102–12°C (feels 8°C) · 10 rain days (105h) · 194 sun hours · 58% humidity · Quiet crowd · UV 2 (low) · sunniest 1 in 10 days reach 3 (moderate)
April
6/105–15°C (feels 12°C) · 12 rain days (151h) · 208 sun hours · 56% humidity · Moderate crowd · UV 4 (moderate) · sunniest 1 in 10 days reach 5 (moderate)
May
7/1010–19°C (feels 18°C) · 15 rain days (165h) · 232 sun hours · 58% humidity · Moderate crowd · UV 5 (moderate) · sunniest 1 in 10 days reach 6 (high)
August
8/1016–26°C · 14 rain days (154h) · 242 sun hours · 59% humidity · Peak crowd · UV 5 (moderate) · sunniest 1 in 10 days reach 7 (high)
October
7/108–16°C (feels 15°C) · 10 rain days (110h) · 165 sun hours · 72% humidity · Moderate crowd · UV 2 (low) · sunniest 1 in 10 days reach 3 (moderate)
November
5/102–9°C (feels 6°C) · 10 rain days (124h) · 111 sun hours · 80% humidity · Moderate crowd · UV 1 (low)
December
3/100–5°C (feels 2°C) · 12 rain days (173h) · 87 sun hours · 82% humidity · Quiet crowd · UV 1 (low)
The cultural year detonates in one week in September
Linz does not spread its cultural calendar across a season. It concentrates it into a few days in early September, and has done since 1979.
That year the Klangwolke — a free open-air spectacle in the Donaupark — was invented as the opening night of the very first Ars Electronica Festival. The two remain welded together: in 2026 the Klangwolke week ran 4 to 12 September with the festival overlapping it from the 9th to the 13th. Admission to every Klangwolke has been free since the beginning, and cumulative attendance has passed four million.
Linz was named a UNESCO City of Media Arts in December 2014, which is the formal recognition of that same concentration. Outside the September window the city is a pleasant Danube stop; inside it, it is something else entirely.
Sources: Ars Electronica — festival dates and programme , Brucknerhaus Linz — Linzer Klangwolke, origin and programme
When is the Ars Electronica Festival in Linz?
Early September — the 2026 edition ran 9 to 13 September, with the Klangwolke week running 4 to 12 September alongside it. The festival has been held since 1979. Dates and venues both shift year to year, so check the organisers rather than assuming a fixed week.
What is the Klangwolke?
A free open-air sound and light spectacle in the Donaupark, created in 1979 as the opening night of the first Ars Electronica Festival. It has been free every year since, with cumulative attendance passing four million. There are now several formats, including a classical edition and one for children.
Is Linz worth visiting?
Yes, particularly in early September when the Ars Electronica Festival and the Klangwolke run together — Linz has been a UNESCO City of Media Arts since December 2014, and that week is what earned it. Outside then it is a comfortable Danube city with good museums and a striking modern art gallery.
What is the best month to visit Linz?
Early September for the festival, or May and June for warm weather without it. July is warmest at about 25C but also the wettest month at around 94mm, arriving as afternoon storms. January lows near -3C make winter cold but the Christmas markets are a genuine draw.
When is the Grottenbahn open in Linz?
Daily from 1 March to 1 November, then only on Advent Sundays plus 8 and 24 December. It is a fairytale railway inside the Poestlingberg fortification tower, established in 1906. That winter schedule catches people out — outside those specific December dates it is simply shut.
How do you get up the Poestlingberg?
By the Poestlingbergbahn, a mountain tramway opened in 1898 that runs from Hauptplatz to the summit in about 20 minutes, with a maximum gradient of 11.6%. Services run at 30-minute intervals, more frequently at weekends and holidays in the main season. The summit has the Grottenbahn and a basilica.
How many days do you need in Linz?
Two. One for the old town, the Hauptplatz, the Lentos art museum and the Ars Electronica Center; one for the Poestlingberg and a Danube walk or boat. During the September festival, allow more — the programme spreads across several venues and the Klangwolke is an evening event.
What is Linzer Torte?
A latticed jam tart with a nut-based pastry, named for the city. The oldest surviving recipe dates from 1653, in a cookbook now held as Codex 35/31 in the archive of Admont Abbey in Styria — not in Linz itself, which surprises people who go looking for it here.
What is the wettest month in Linz?
July, at around 94mm, which coincides with the warmest weather at about 25C — the rain is convective, building into afternoon storms rather than falling all day. February is driest at about 50mm. The Danube valley can hold fog in late autumn, which limits the views from the Poestlingberg.
Is Linz better than Salzburg or Vienna?
Different in scale and purpose. Vienna and Salzburg are the classical heavyweights; Linz is industrial, modern and built its identity on media art rather than on Mozart or the Habsburgs. It is cheaper and far less crowded. Go for Ars Electronica, or as a Danube stop between the other two.
Frequently asked questions about visiting Linz
When is the best time to visit Linz?
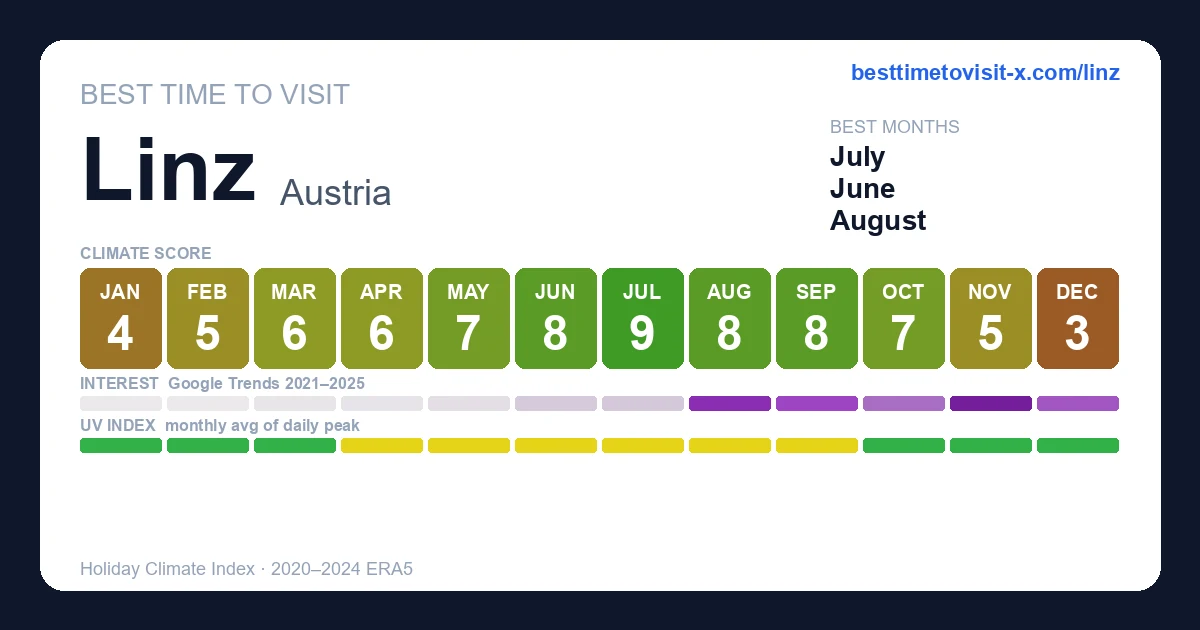
July is the highest-scoring month (9/10 on the Holiday Climate Index). Typical conditions: 16–27°C (11 rainy days). The top three months by score are July, September, June.
What is the worst time to visit Linz?
December is the lowest-scoring month (3/10). Typical conditions: 0–5°C (12 rainy days).
When are crowds lowest in Linz?
Search-interest seasonality (Google Trends 2021-2025) is lowest in December and peaks in July. Interest tracks both in-trip visitors and lead-time planners, so treat it as a "destination is on people's minds" signal rather than literal arrivals.
Which months in Linz have good weather but fewer tourists?
May (climate 7/10, crowd index 42) — shoulder months with above-average climate and below-median search-interest. Often the best value-for-weather trade.
What is the UV index in Linz by month?
UV peaks at 6 (moderate) in June and is lowest in December at 1 (low). Monthly peak values: Jan 1, Feb 1, Mar 2, Apr 4, May 5, Jun 6, Jul 6, Aug 5, Sep 4, Oct 2, Nov 1, Dec 1.
What is the UV index in Linz in June?
June is the peak UV month in Linz, with a daily-peak UV index of 6 (moderate). Standard sun protection — sunglasses and light SPF — is recommended.
How high can UV get in Linz on the sunniest days?
Most days look like the monthly average, but on the sunniest ~1 in 10 days UV climbs higher than the mean suggests. June is the worst case: typical days average UV 6 (moderate), but the top 10% of days reach UV 8 (high) — and even higher. Months where the sunniest days routinely exceed the typical reading: March, April, May, June, July, August, September, October. Plan sun protection for the worst case, not the average.
Is air quality in Linz bad for travelers?
PM2.5 (fine-particle pollution) exceeds the WHO sensitive-group guideline (15 µg/m³) in 6 months: January, February, March, October, November, December. The worst month is December with a typical-day mean of 17 µg/m³ (unhealthy for sensitive); on the worst 10% of days PM2.5 reaches 28 µg/m³ (unhealthy) and higher. People with asthma, heart conditions, or sensitive children may want to avoid these months or limit outdoor activity. Source: CAMS via Open-Meteo.