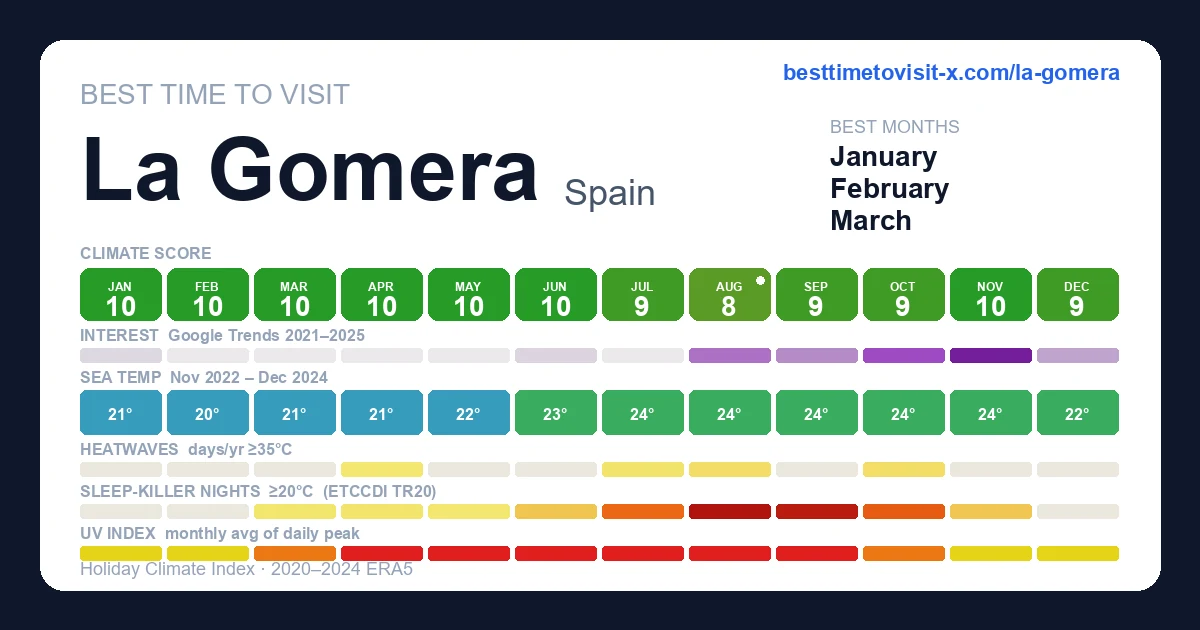
January 10/10 beach 10/10 urban
feels 21°C
(+2°C vs 1991-2020) · HCI 97/100
Day 22° · Night 15°
59% humidity 16 km/h wind 3 rain days (51h) 227h sun
sea 21°C
Thermal 9
Sky 10
Rain 10
Wind 10
Higher = better, including rain & wind (green = "doesn't hurt the score", not "lots of it").
February 10/10 beach 10/10 urban
feels 22°C
(+3°C vs 1991-2020) · HCI 98/100
Day 23° · Night 16°
56% humidity 18 km/h wind 3 rain days (45h) 228h sun
sea 20°C
Thermal 9
Sky 10
Rain 10
Wind 10
Higher = better, including rain & wind (green = "doesn't hurt the score", not "lots of it").
March 10/10 beach 9/10 urban
feels 22°C
(+3°C vs 1991-2020) · HCI 96/100
Day 23° · Night 16°
57% humidity 20 km/h wind 4 rain days (58h) 263h sun
sea 21°C
Thermal 9
Sky 10
Rain 9
Wind 10
Higher = better, including rain & wind (green = "doesn't hurt the score", not "lots of it").
April 10/10 beach 10/10 urban
feels 24°C
(+4°C vs 1991-2020) · HCI 98/100
Day 24° · Night 17°
⚠ <1 days/yr ≥35°
· peak 4 in worst year
☀ UV 8.7 (very high)
55% humidity 17 km/h wind 4 rain days (43h) 271h sun
sea 21°C
Thermal 9
Sky 10
Rain 10
Wind 10
Higher = better, including rain & wind (green = "doesn't hurt the score", not "lots of it").
May 10/10 beach 10/10 urban
feels 24°C
(+2°C vs 1991-2020) · HCI 98/100
Day 25° · Night 18°
☀ UV 9.7 (very high)
56% humidity 20 km/h wind 2 rain days (28h) 299h sun
sea 22°C
Thermal 9
Sky 10
Rain 10
Wind 10
Higher = better, including rain & wind (green = "doesn't hurt the score", not "lots of it").
June 10/10 beach 10/10 urban
feels 26°C
(+1°C vs 1991-2020) · HCI 98/100
Day 26° · Night 19°
🌙 6 tropical nights/yr
· peak 19
☀ UV 10.6 (very high)
58% humidity 19 km/h wind 2 rain days (34h) 296h sun
sea 23°C
Thermal 9
Sky 10
Rain 10
Wind 10
Higher = better, including rain & wind (green = "doesn't hurt the score", not "lots of it").
July 9/10 beach 9/10 urban
feels 28°C
(+1°C vs 1991-2020) · HCI 94/100
Day 28° · Night 20°
· cools 8° at night
⚠ 1.6 days/yr ≥35°
· peak 5 in worst year
🌙 18 tropical nights/yr
· peak 31
☀ UV 10.4 (very high)
58% humidity 25 km/h wind 0 rain days (5h) 298h sun
sea 24°C
Thermal 8
Sky 10
Rain 10
Wind 9
Higher = better, including rain & wind (green = "doesn't hurt the score", not "lots of it").
August 8/10 beach 8/10 urban
feels 30°C
(+1°C vs 1991-2020) · extreme heat caps 93 → 82/100
Day 29° · Night 21°
· cools 8° at night
⚠ 2.6 days/yr ≥35°
· peak 7 in worst year
🌙 29 tropical nights/yr
· peak 31
☀ UV 9.7 (very high)
57% humidity 24 km/h wind 1 rain day (10h) 279h sun
sea 24°C
Thermal 7
Sky 10
Rain 10
Wind 9
Higher = better, including rain & wind (green = "doesn't hurt the score", not "lots of it").
Greyed factors are scored normally — extreme heat overrides them, so a clear sky or low rain can't lift the period.
September 9/10 beach 8/10 urban
feels 29°C
(+1°C vs 1991-2020) · HCI 86/100
Day 28° · Night 21°
🌙 27 tropical nights/yr
· peak 30
☀ UV 8.7 (very high)
60% humidity 17 km/h wind 3 rain days (36h) 255h sun
sea 24°C
Thermal 7
Sky 10
Rain 10
Wind 10
Higher = better, including rain & wind (green = "doesn't hurt the score", not "lots of it").
October 9/10 beach 9/10 urban
feels 29°C
(+3°C vs 1991-2020) · HCI 92/100
Day 28° · Night 21°
⚠ 2.6 days/yr ≥35°
· peak 12 in worst year
🌙 19 tropical nights/yr
· peak 26 56% humidity 16 km/h wind 2 rain days (29h) 248h sun
sea 25°C
Thermal 8
Sky 10
Rain 10
Wind 10
Higher = better, including rain & wind (green = "doesn't hurt the score", not "lots of it").
November 10/10 beach 10/10 urban
feels 26°C
(+3°C vs 1991-2020) · HCI 98/100
Day 26° · Night 19°
🌙 6 tropical nights/yr
· peak 14 56% humidity 15 km/h wind 4 rain days (46h) 213h sun
sea 24°C
Thermal 9
Sky 10
Rain 10
Wind 10
Higher = better, including rain & wind (green = "doesn't hurt the score", not "lots of it").
December 9/10 beach 9/10 urban
feels 23°C
(+3°C vs 1991-2020) · HCI 94/100
Day 23° · Night 17°
62% humidity 15 km/h wind 5 rain days (71h) 224h sun
sea 22°C
Thermal 9
Sky 10
Rain 9
Wind 10
Higher = better, including rain & wind (green = "doesn't hurt the score", not "lots of it").
January 1–10 9/10 beach 9/10 urban
feels 21°C
(+2°C vs 1991-2020) · HCI 91/100
Day 22° · Night 16°
63% humidity 16 km/h wind 2 rain days (27h) 70h sun
sea 22°C
Thermal 9
Sky 10
Rain 9
Wind 10
Higher = better, including rain & wind (green = "doesn't hurt the score", not "lots of it").
January 11–20 10/10 beach 10/10 urban
feels 20°C
(+1°C vs 1991-2020) · HCI 98/100
Day 21° · Night 15°
59% humidity 17 km/h wind 1 rain day (12h) 73h sun
sea 21°C
Thermal 9
Sky 10
Rain 10
Wind 10
Higher = better, including rain & wind (green = "doesn't hurt the score", not "lots of it").
January 21–31 10/10 beach 10/10 urban
feels 21°C
(+3°C vs 1991-2020) · HCI 99/100
Day 22° · Night 15°
55% humidity 16 km/h wind 1 rain day (12h) 84h sun
sea 21°C
Thermal 9
Sky 10
Rain 10
Wind 10
Higher = better, including rain & wind (green = "doesn't hurt the score", not "lots of it").
February 1–10 10/10 beach 10/10 urban
feels 22°C
(+3°C vs 1991-2020) · HCI 96/100
Day 23° · Night 16°
53% humidity 16 km/h wind 2 rain days (21h) 78h sun
sea 20°C
Thermal 10
Sky 10
Rain 9
Wind 10
Higher = better, including rain & wind (green = "doesn't hurt the score", not "lots of it").
February 11–20 10/10 beach 10/10 urban
feels 22°C
(+3°C vs 1991-2020) · HCI 98/100
Day 23° · Night 16°
56% humidity 18 km/h wind 1 rain day (14h) 81h sun
sea 21°C
Thermal 9
Sky 10
Rain 10
Wind 10
Higher = better, including rain & wind (green = "doesn't hurt the score", not "lots of it").
February 21–28 10/10 beach 10/10 urban
feels 21°C
(+2°C vs 1991-2020) · HCI 97/100
Day 22° · Night 16°
59% humidity 21 km/h wind 0 rain days (10h) 69h sun
sea 21°C
Thermal 9
Sky 10
Rain 10
Wind 10
Higher = better, including rain & wind (green = "doesn't hurt the score", not "lots of it").
March 1–10 10/10 beach 10/10 urban
feels 21°C
(+2°C vs 1991-2020) · HCI 98/100
Day 22° · Night 16°
60% humidity 20 km/h wind 1 rain day (11h) 83h sun
sea 21°C
Thermal 9
Sky 10
Rain 10
Wind 10
Higher = better, including rain & wind (green = "doesn't hurt the score", not "lots of it").
March 11–20 10/10 beach 10/10 urban
feels 22°C
(+3°C vs 1991-2020) · HCI 98/100
Day 23° · Night 16°
56% humidity 21 km/h wind 1 rain day (9h) 84h sun
sea 21°C
Thermal 9
Sky 10
Rain 10
Wind 10
Higher = better, including rain & wind (green = "doesn't hurt the score", not "lots of it").
March 21–31 8/10 beach 9/10 urban
feels 22°C
(+3°C vs 1991-2020) · HCI 84/100
Day 23° · Night 16°
54% humidity 19 km/h wind 3 rain days (38h) 97h sun
sea 21°C
Thermal 10
Sky 8
Rain 7
Wind 10
Higher = better, including rain & wind (green = "doesn't hurt the score", not "lots of it").
April 1–10 10/10 beach 10/10 urban
feels 23°C
(+3°C vs 1991-2020) · HCI 98/100
Day 23° · Night 16°
⚠ <1 days/yr ≥35°
· peak 4 in worst year
☀ UV 8.2 (very high)
59% humidity 17 km/h wind 1 rain day (12h) 89h sun
sea 21°C
Thermal 9
Sky 10
Rain 10
Wind 10
Higher = better, including rain & wind (green = "doesn't hurt the score", not "lots of it").
April 11–20 10/10 beach 10/10 urban
feels 25°C
(+5°C vs 1991-2020) · HCI 100/100
Day 26° · Night 18°
· cools 8° at night
⚠ <1 days/yr ≥35°
· peak 4 in worst year
☀ UV 8.4 (very high)
51% humidity 18 km/h wind 1 rain day (8h) 91h sun
sea 21°C
Thermal 10
Sky 10
Rain 10
Wind 10
Higher = better, including rain & wind (green = "doesn't hurt the score", not "lots of it").
April 21–30 9/10 beach 9/10 urban
feels 23°C
(+2°C vs 1991-2020) · HCI 95/100
Day 24° · Night 17°
⚠ <1 days/yr ≥35°
· peak 4 in worst year
☀ UV 9.3 (very high)
56% humidity 16 km/h wind 2 rain days (23h) 91h sun
sea 21°C
Thermal 9
Sky 10
Rain 9
Wind 10
Higher = better, including rain & wind (green = "doesn't hurt the score", not "lots of it").
May 1–10 10/10 beach 10/10 urban
feels 24°C
(+3°C vs 1991-2020) · HCI 99/100
Day 25° · Night 18°
☀ UV 9.5 (very high)
54% humidity 20 km/h wind 0 rain days (1h) 94h sun
sea 22°C
Thermal 10
Sky 10
Rain 10
Wind 10
Higher = better, including rain & wind (green = "doesn't hurt the score", not "lots of it").
May 11–20 10/10 beach 9/10 urban
feels 24°C
(+2°C vs 1991-2020) · HCI 97/100
Day 24° · Night 18°
☀ UV 9.5 (very high)
59% humidity 21 km/h wind 1 rain day (17h) 95h sun
sea 21°C
Thermal 9
Sky 10
Rain 10
Wind 10
Higher = better, including rain & wind (green = "doesn't hurt the score", not "lots of it").
May 21–31 10/10 beach 10/10 urban
feels 25°C
(+2°C vs 1991-2020) · HCI 99/100
Day 25° · Night 18°
☀ UV 10 (very high)
55% humidity 19 km/h wind 1 rain day (10h) 110h sun
sea 22°C
Thermal 9
Sky 10
Rain 10
Wind 10
Higher = better, including rain & wind (green = "doesn't hurt the score", not "lots of it").
June 1–10 10/10 beach 10/10 urban
feels 26°C
(+2°C vs 1991-2020) · HCI 97/100
Day 26° · Night 19°
🌙 6 tropical nights/yr
· peak 19
☀ UV 10.4 (very high)
58% humidity 18 km/h wind 1 rain day (20h) 97h sun
sea 22°C
Thermal 9
Sky 10
Rain 10
Wind 10
Higher = better, including rain & wind (green = "doesn't hurt the score", not "lots of it").
June 11–20 10/10 beach 10/10 urban
feels 27°C
(+2°C vs 1991-2020) · HCI 98/100
Day 26° · Night 19°
🌙 6 tropical nights/yr
· peak 19
☀ UV 10.5 (very high)
57% humidity 18 km/h wind 1 rain day (9h) 100h sun
sea 23°C
Thermal 9
Sky 10
Rain 10
Wind 10
Higher = better, including rain & wind (green = "doesn't hurt the score", not "lots of it").
June 21–30 10/10 beach 10/10 urban
feels 26°C
· HCI 98/100
Day 26° · Night 20°
🌙 6 tropical nights/yr
· peak 19
☀ UV 10.7 (very high)
59% humidity 22 km/h wind 0 rain days (5h) 100h sun
sea 23°C
Thermal 9
Sky 10
Rain 10
Wind 10
Higher = better, including rain & wind (green = "doesn't hurt the score", not "lots of it").
July 1–10 10/10 beach 9/10 urban
feels 27°C
(+1°C vs 1991-2020) · HCI 97/100
Day 27° · Night 20°
⚠ 1.6 days/yr ≥35°
· peak 5 in worst year
🌙 18 tropical nights/yr
· peak 31
☀ UV 10.6 (very high)
60% humidity 23 km/h wind 0 rain days (1h) 98h sun
sea 24°C
Thermal 9
Sky 10
Rain 10
Wind 9
Higher = better, including rain & wind (green = "doesn't hurt the score", not "lots of it").
July 11–20 9/10 beach 8/10 urban
feels 29°C
(+2°C vs 1991-2020) · HCI 88/100
Day 29° · Night 21°
· cools 8° at night
⚠ 1.6 days/yr ≥35°
· peak 5 in worst year
🌙 18 tropical nights/yr
· peak 31
☀ UV 10.2 (very high)
54% humidity 24 km/h wind 0 rain days (1h) 96h sun
sea 24°C
Thermal 8
Sky 10
Rain 10
Wind 9
Higher = better, including rain & wind (green = "doesn't hurt the score", not "lots of it").
July 21–31 9/10 beach 9/10 urban
feels 28°C
· HCI 93/100
Day 28° · Night 21°
⚠ 1.6 days/yr ≥35°
· peak 5 in worst year
🌙 18 tropical nights/yr
· peak 31
☀ UV 10.6 (very high)
60% humidity 26 km/h wind 0 rain days (3h) 104h sun
sea 24°C
Thermal 8
Sky 10
Rain 10
Wind 9
Higher = better, including rain & wind (green = "doesn't hurt the score", not "lots of it").
August 1–10 9/10 beach 9/10 urban
feels 29°C
(+1°C vs 1991-2020) · HCI 91/100
Day 28° · Night 21°
⚠ 2.6 days/yr ≥35°
· peak 7 in worst year
🌙 29 tropical nights/yr
· peak 31
☀ UV 10.1 (very high)
62% humidity 24 km/h wind 0 rain days (1h) 94h sun
sea 24°C
Thermal 7
Sky 10
Rain 10
Wind 9
Higher = better, including rain & wind (green = "doesn't hurt the score", not "lots of it").
August 11–20 8/10 beach 7/10 urban
feels 31°C
(+2°C vs 1991-2020) · extreme heat caps 92 → 77/100
Day 30° · Night 22°
· cools 8° at night
⚠ 2.6 days/yr ≥35°
· peak 7 in worst year
🌙 29 tropical nights/yr
· peak 31
☀ UV 9.2 (very high)
54% humidity 25 km/h wind 1 rain day (4h) 90h sun
sea 24°C
Thermal 6
Sky 10
Rain 10
Wind 9
Higher = better, including rain & wind (green = "doesn't hurt the score", not "lots of it").
Greyed factors are scored normally — extreme heat overrides them, so a clear sky or low rain can't lift the period.
August 21–31 8/10 beach 7/10 urban
feels 31°C
(+2°C vs 1991-2020) · extreme heat caps 92 → 78/100
Day 30° · Night 22°
· cools 8° at night
⚠ 2.6 days/yr ≥35°
· peak 7 in worst year
🌙 29 tropical nights/yr
· peak 31
☀ UV 9.7 (very high)
55% humidity 24 km/h wind 1 rain day (5h) 95h sun
sea 24°C
Thermal 6
Sky 10
Rain 10
Wind 9
Higher = better, including rain & wind (green = "doesn't hurt the score", not "lots of it").
Greyed factors are scored normally — extreme heat overrides them, so a clear sky or low rain can't lift the period.
September 1–10 8/10 beach 7/10 urban
feels 30°C
(+1°C vs 1991-2020) · extreme heat caps 93 → 81/100
Day 29° · Night 21°
· cools 8° at night
🌙 27 tropical nights/yr
· peak 30
☀ UV 9.4 (very high)
60% humidity 18 km/h wind 1 rain day (10h) 88h sun
sea 24°C
Thermal 6
Sky 10
Rain 10
Wind 10
Higher = better, including rain & wind (green = "doesn't hurt the score", not "lots of it").
Greyed factors are scored normally — extreme heat overrides them, so a clear sky or low rain can't lift the period.
September 11–20 9/10 beach 8/10 urban
feels 30°C
(+2°C vs 1991-2020) · HCI 85/100
Day 28° · Night 21°
🌙 27 tropical nights/yr
· peak 30
☀ UV 8.6 (very high)
58% humidity 17 km/h wind 1 rain day (11h) 85h sun
sea 24°C
Thermal 7
Sky 10
Rain 10
Wind 10
Higher = better, including rain & wind (green = "doesn't hurt the score", not "lots of it").
September 21–30 9/10 beach 9/10 urban
feels 29°C
(+1°C vs 1991-2020) · HCI 92/100
Day 27° · Night 21°
🌙 27 tropical nights/yr
· peak 30
☀ UV 8.1 (very high)
61% humidity 18 km/h wind 1 rain day (16h) 82h sun
sea 25°C
Thermal 8
Sky 10
Rain 10
Wind 10
Higher = better, including rain & wind (green = "doesn't hurt the score", not "lots of it").
October 1–10 8/10 beach 8/10 urban
feels 30°C
(+3°C vs 1991-2020) · extreme heat caps 94 → 83/100
Day 29° · Night 22°
⚠ 2.6 days/yr ≥35°
· peak 12 in worst year
🌙 19 tropical nights/yr
· peak 26 55% humidity 19 km/h wind 0 rain days (6h) 84h sun
sea 24°C
Thermal 7
Sky 10
Rain 10
Wind 10
Higher = better, including rain & wind (green = "doesn't hurt the score", not "lots of it").
Greyed factors are scored normally — extreme heat overrides them, so a clear sky or low rain can't lift the period.
October 11–20 8/10 beach 8/10 urban
feels 30°C
(+4°C vs 1991-2020) · extreme heat caps 94 → 83/100
Day 29° · Night 21°
· cools 8° at night
⚠ 2.6 days/yr ≥35°
· peak 12 in worst year
🌙 19 tropical nights/yr
· peak 26 55% humidity 14 km/h wind 1 rain day (10h) 79h sun
sea 25°C
Thermal 7
Sky 10
Rain 10
Wind 10
Higher = better, including rain & wind (green = "doesn't hurt the score", not "lots of it").
Greyed factors are scored normally — extreme heat overrides them, so a clear sky or low rain can't lift the period.
October 21–31 10/10 beach 10/10 urban
feels 26°C
(+1°C vs 1991-2020) · HCI 98/100
Day 26° · Night 19°
⚠ 2.6 days/yr ≥35°
· peak 12 in worst year
🌙 19 tropical nights/yr
· peak 26 59% humidity 16 km/h wind 1 rain day (14h) 84h sun
sea 25°C
Thermal 9
Sky 10
Rain 10
Wind 10
Higher = better, including rain & wind (green = "doesn't hurt the score", not "lots of it").
November 1–10 10/10 beach 10/10 urban
feels 26°C
(+2°C vs 1991-2020) · HCI 98/100
Day 26° · Night 19°
🌙 6 tropical nights/yr
· peak 14 58% humidity 16 km/h wind 0 rain days (8h) 74h sun
sea 24°C
Thermal 9
Sky 10
Rain 10
Wind 10
Higher = better, including rain & wind (green = "doesn't hurt the score", not "lots of it").
November 11–20 10/10 beach 10/10 urban
feels 27°C
(+4°C vs 1991-2020) · HCI 99/100
Day 27° · Night 19°
· cools 8° at night
🌙 6 tropical nights/yr
· peak 14 52% humidity 14 km/h wind 1 rain day (10h) 72h sun
sea 24°C
Thermal 10
Sky 10
Rain 10
Wind 10
Higher = better, including rain & wind (green = "doesn't hurt the score", not "lots of it").
November 21–30 9/10 beach 9/10 urban
feels 25°C
(+3°C vs 1991-2020) · HCI 89/100
Day 24° · Night 18°
🌙 6 tropical nights/yr
· peak 14 59% humidity 16 km/h wind 3 rain days (28h) 67h sun
sea 23°C
Thermal 9
Sky 9
Rain 8
Wind 10
Higher = better, including rain & wind (green = "doesn't hurt the score", not "lots of it").
December 1–10 9/10 beach 8/10 urban
feels 23°C
(+2°C vs 1991-2020) · HCI 85/100
Day 23° · Night 17°
67% humidity 18 km/h wind 2 rain days (34h) 69h sun
sea 23°C
Thermal 8
Sky 9
Rain 8
Wind 10
Higher = better, including rain & wind (green = "doesn't hurt the score", not "lots of it").
December 11–20 10/10 beach 9/10 urban
feels 23°C
(+3°C vs 1991-2020) · HCI 97/100
Day 23° · Night 16°
61% humidity 14 km/h wind 1 rain day (12h) 74h sun
sea 23°C
Thermal 9
Sky 10
Rain 10
Wind 10
Higher = better, including rain & wind (green = "doesn't hurt the score", not "lots of it").
December 21–31 9/10 beach 9/10 urban
feels 22°C
(+2°C vs 1991-2020) · HCI 93/100
Day 23° · Night 16°
59% humidity 14 km/h wind 2 rain days (25h) 81h sun
sea 22°C
Thermal 9
Sky 10
Rain 9
Wind 10
Higher = better, including rain & wind (green = "doesn't hurt the score", not "lots of it").
 Private excursion to Teide National Park
 Hiking in the Garajonay
 Small Group Boat Whale and Dolphin Watching Tour
 Inflatable boat without a license
 Kayaks for rent in Playa de Santiago
 Paddle Surf Rental Playa de Santiago