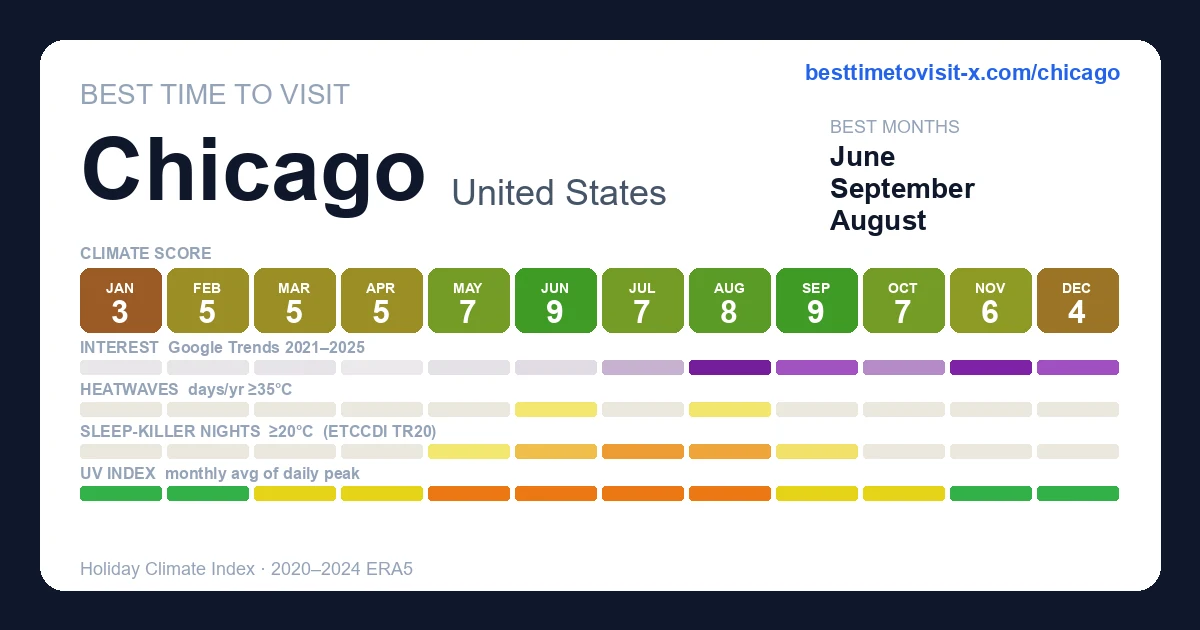
Best time to visit Chicago
Re-score for me — drag the dial — every chart on the page recolours live for your heat limit 27°C
Default 27 °C is the upper edge of the Holiday Climate Index "ideal comfort" band (Scott, Rutty, Amelung & Tang, 2016). Above this, most warm-tourism travellers report measurable discomfort.
Greyed factors are scored normally — extreme cold overrides them, so a clear sky or low rain can't lift the period.
Greyed factors are scored normally — extreme cold overrides them, so a clear sky or low rain can't lift the period.
Greyed factors are scored normally — extreme cold overrides them, so a clear sky or low rain can't lift the period.
Greyed factors are scored normally — extreme cold overrides them, so a clear sky or low rain can't lift the period.
Greyed factors are scored normally — extreme cold overrides them, so a clear sky or low rain can't lift the period.
Greyed factors are scored normally — extreme cold overrides them, so a clear sky or low rain can't lift the period.
How is this scored? HCI / Steadman / CCI gate — full methodology and citations below.
Compare with another destination
Add as many as you like — stacked below the main strips above. Each row is just the recent-window score strip and (for beach destinations) sea-temperature strip.
Tours in Chicago
24 top-rated tours via Viator. Booking links earn this site a commission at no cost to you.
- 1
 Chicago River 90-Minute Architecture Boat Tour
 - 2
 Chicago City Minibus Tour
 - 3
 Chicago Murder Mystery Tour
 - 4
 Chicago River 90-Minute Architecture Tour
 - 5
 Chicago River 45-Minute Architecture Tour from Magnificent Mile
 - 6
 Lake Michigan Sunset Cruise in Chicago
 - 7
 Chicago Lake and River Architecture Tour
 - 8
 Chicago City Tour with Architecture River Cruise Option
 - 9
 Chicago Small Group City Tour
 - 10
 Luxury Minibus Chicago City Tour
 - 11
 Chicago Craft Brewery Barrel Bus Tour
 - 12
 Chicago's Ultimate City Bike Tour of Top Downtown Attractions
 - 13
 Chicago Architecture River Cruise
 - 14
 Chicago Favorites Ultimate Food and Walking Tour
 - 15
 Chicago in a Day Walking Tour: Food, History & Architecture
 - 16
 Chicago's Chinatown Food and Walking Tour
 - 17
 Original Chicago Architecture Interiors Tour: Dazzling Interiors
 - 18
 Chicago Bike & Classic Food Tour: Bikes, Bites & Views - Adults
 - 19
 Chicago Food Tour: 6 Dishes with Deep Dish Pizza & Beef Sandwich
 - 20
 Skip-the-line: Art Institute of Chicago Guided Tour
 - 21
 Delicious Donuts & City Sights: Chicago's Original Donut Tour
 - 22
 Medieval Torture Museum Ticket with Audio Guide and Ghost Hunting
 - 23
 Chicago Crime and Mob Bus Tour
 - 24
 Trickery Chicago Magic Show
Last refreshed 2026-05-25.
Similar climatesToronto93% · Boston93% · Niagara Falls93%
Other destinations with the most-alike year-round climate to Chicago (apparent temperature, rain hours, sunshine — matched within the same trip-profile). The ±N chip compares each match's typical score for the current month against Chicago's. Based on the 2020-2024 climatology, not this year's actual weather.
Month-by-month
| Month | Temp °C | Feels °C | Rain days | Rain h | Rain h/day | Humidity | Wind km/h | Sun h | UV | Interest | Score |
|---|---|---|---|---|---|---|---|---|---|---|---|
| Jan | -6–1 | -5 | 11 | 152 | 13.8 | 73% | 26 | 102 | 1 | Quiet | 3 |
| Feb | -6–3 | -3 | 9 | 103 | 11.4 | 67% | 28 | 153 | 2 | Quiet | 5 |
| Mar | 0–9 | 4 | 12 | 119 | 9.9 | 66% | 29 | 177 | 3 | Quiet | 5 |
| Apr | 4–14 | 9 | 15 | 139 | 9.3 | 62% | 28 | 198 | 5 | Quiet | 5 |
| May | 10–19 | 17 | 11 | 119 | 10.8 | 64% | 25 | 238 | 6 | Quiet | 7 |
| Jun | 17–26 | 26 | 10 | 95 | 9.5 | 57% | 25 | 265 | 7 | Quiet | 9 |
| Jul | 19–27 | 28 | 12 | 124 | 10.3 | 65% | 22 | 271 | 7 | Quiet | 7 |
| Aug | 19–27 | 28 | 11 | 101 | 9.2 | 62% | 22 | 270 | 7 | Peak | 8 |
| Sep | 16–24 | 23 | 8 | 88 | 11.0 | 60% | 24 | 217 | 5 | Busy | 9 |
| Oct | 9–17 | 14 | 12 | 135 | 11.3 | 61% | 27 | 181 | 3 | Moderate | 7 |
| Nov | 3–10 | 6 | 7 | 77 | 11.0 | 64% | 26 | 144 | 2 | Peak | 6 |
| Dec | -2–4 | -1 | 9 | 97 | 10.8 | 70% | 25 | 108 | 1 | Busy | 4 |
UV Index in Chicago by Month
UV index in Chicago peaks at 7 (high) in June, dropping to 1 (low) in December. May, June, July, August have high UV — SPF 30+ and sunglasses recommended.
Best months in detail
September
9/1016–24°C (feels 23°C) · 8 rain days (88h) · 217 sun hours · 60% humidity · Busy crowd · UV 5 (moderate) · sunniest 1 in 10 days reach 7 (high)
June
9/1017–26°C · 10 rain days (95h) · 265 sun hours · 57% humidity · Quiet crowd · UV 7 (high) · sunniest 1 in 10 days reach 9 (very high)
August
8/1019–27°C · 11 rain days (101h) · 270 sun hours · 62% humidity · Peak crowd · UV 7 (high)
Every month
Show the other 9 months in detail
January
3/10-6–1°C (feels -5°C) · 11 rain days (152h) · 102 sun hours · 73% humidity · Quiet crowd · UV 1 (low)
February
5/10-6–3°C (feels -3°C) · 9 rain days (103h) · 153 sun hours · 67% humidity · Quiet crowd · UV 2 (low) · sunniest 1 in 10 days reach 3 (moderate)
March
5/100–9°C (feels 4°C) · 12 rain days (119h) · 177 sun hours · 66% humidity · Quiet crowd · UV 3 (moderate)
April
5/104–14°C (feels 9°C) · 15 rain days (139h) · 198 sun hours · 62% humidity · Quiet crowd · UV 5 (moderate) · sunniest 1 in 10 days reach 7 (high)
May
7/1010–19°C (feels 17°C) · 11 rain days (119h) · 238 sun hours · 64% humidity · Quiet crowd · UV 6 (high) · sunniest 1 in 10 days reach 8 (high)
July
7/1019–27°C (feels 28°C) · 12 rain days (124h) · 271 sun hours · 65% humidity · Quiet crowd · UV 7 (high) · sunniest 1 in 10 days reach 9 (very high)
October
7/109–17°C (feels 14°C) · 12 rain days (135h) · 181 sun hours · 61% humidity · Moderate crowd · UV 3 (moderate) · sunniest 1 in 10 days reach 5 (moderate)
November
6/103–10°C (feels 6°C) · 7 rain days (77h) · 144 sun hours · 64% humidity · Peak crowd · UV 2 (low)
December
4/10-2–4°C (feels -1°C) · 9 rain days (97h) · 108 sun hours · 70% humidity · Busy crowd · UV 1 (low)
Comparisons people search for
Pairs validated by Google Autocomplete demand — only pairs people actually compare.
- Chicago vs London
- Chicago vs New Orleans
- Chicago vs Tokyo
- Chicago vs Vancouver
- Chicago vs San Francisco
- Chicago vs Dubai
- Chicago vs Montreal
- Chicago vs Rio de Janeiro
- Chicago vs Nashville
- Chicago vs Berlin
- Chicago vs San Diego
- Chicago vs Edmonton
- Chicago vs Raleigh
- Chicago vs Quebec City
- Chicago vs Las Vegas
- Chicago vs Buenos Aires
- Chicago vs New York City
- Chicago vs Honolulu
- Chicago vs Sydney
Frequently asked questions about visiting Chicago
When is the best time to visit Chicago?
September is the highest-scoring month (9/10 on the Holiday Climate Index). Typical conditions: 16–24°C (8 rainy days). The top three months by score are September, June, August.
What is the worst time to visit Chicago?
January is the lowest-scoring month (3/10). Typical conditions: -6–1°C (11 rainy days).
When are crowds lowest in Chicago?
Search-interest seasonality (Google Trends 2021-2025) is lowest in April and peaks in August. Interest tracks both in-trip visitors and lead-time planners, so treat it as a "destination is on people's minds" signal rather than literal arrivals.
Which months in Chicago have good weather but fewer tourists?
June (climate 9/10, crowd index 7) and May (climate 7/10, crowd index 4) — shoulder months with above-average climate and below-median search-interest. Often the best value-for-weather trade.
What is the UV index in Chicago by month?
UV peaks at 7 (high) in June and is lowest in December at 1 (low). Monthly peak values: Jan 1, Feb 2, Mar 3, Apr 5, May 6, Jun 7, Jul 7, Aug 7, Sep 5, Oct 3, Nov 2, Dec 1.
What is the UV index in Chicago in June?
June is the peak UV month in Chicago, with a daily-peak UV index of 7 (high). Apply SPF 30+, wear sunglasses, and seek shade during midday hours.
How high can UV get in Chicago on the sunniest days?
Most days look like the monthly average, but on the sunniest ~1 in 10 days UV climbs higher than the mean suggests. June is the worst case: typical days average UV 7 (high), but the top 10% of days reach UV 9 (very high) — and even higher. Months where the sunniest days routinely exceed the typical reading: February, April, May, June, July, September, October. Plan sun protection for the worst case, not the average.
Is air quality in Chicago bad for travelers?
PM2.5 (fine-particle pollution) exceeds the WHO sensitive-group guideline (15 µg/m³) in 11 months: January, February, March, April, May, June, July, August, September, November, December. The worst month is June with a typical-day mean of 19 µg/m³ (unhealthy for sensitive); on the worst 10% of days PM2.5 reaches 31 µg/m³ (unhealthy) and higher. People with asthma, heart conditions, or sensitive children may want to avoid these months or limit outdoor activity. Source: CAMS via Open-Meteo.