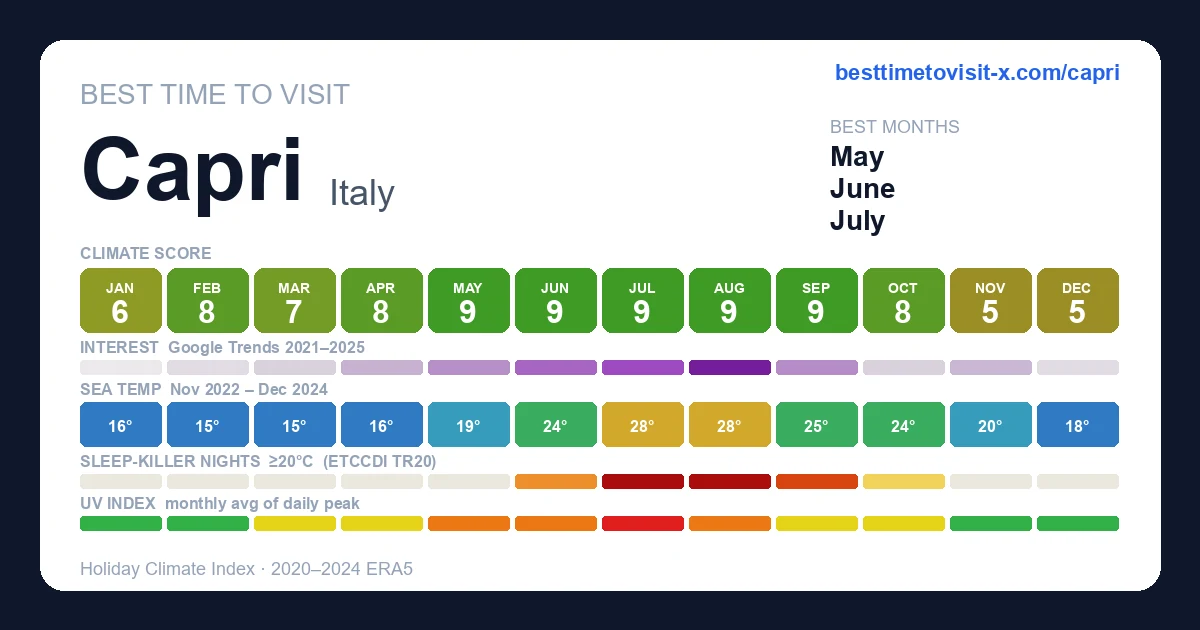
January 6/10 beach 5/10 urban
feels 8°C
(+1°C vs 1991-2020) · HCI 57/100
Day 12° · Night 10°
69% humidity 30 km/h wind 12 rain days (159h) 169h sun
sea 17°C
Thermal 3
Sky 7
Rain 6
Wind 9
Higher = better, including rain & wind (green = "doesn't hurt the score", not "lots of it").
February 8/10 beach 6/10 urban
feels 8°C
(+1°C vs 1991-2020) · HCI 75/100
Day 12° · Night 10°
70% humidity 28 km/h wind 8 rain days (89h) 194h sun
sea 15°C
Thermal 3
Sky 9
Rain 8
Wind 9
Higher = better, including rain & wind (green = "doesn't hurt the score", not "lots of it").
March 7/10 beach 6/10 urban
feels 8°C
(−2°C vs 1991-2020) · HCI 69/100
Day 12° · Night 10°
70% humidity 27 km/h wind 11 rain days (113h) 228h sun
sea 15°C
Thermal 3
Sky 8
Rain 7
Wind 9
Higher = better, including rain & wind (green = "doesn't hurt the score", not "lots of it").
April 8/10 beach 7/10 urban
feels 11°C
(−2°C vs 1991-2020) · HCI 78/100
Day 14° · Night 12°
74% humidity 24 km/h wind 8 rain days (87h) 243h sun
sea 16°C
Thermal 4
Sky 9
Rain 8
Wind 9
Higher = better, including rain & wind (green = "doesn't hurt the score", not "lots of it").
May 9/10 beach 8/10 urban
feels 16°C
(−2°C vs 1991-2020) · HCI 86/100
Day 18° · Night 16°
78% humidity 22 km/h wind 7 rain days (71h) 277h sun
sea 19°C
Thermal 5
Sky 10
Rain 9
Wind 10
Higher = better, including rain & wind (green = "doesn't hurt the score", not "lots of it").
June 9/10 beach 9/10 urban
feels 22°C
(−1°C vs 1991-2020) · HCI 93/100
Day 22° · Night 20°
🌙 14 tropical nights/yr
· peak 24 78% humidity 20 km/h wind 4 rain days (39h) 297h sun
sea 24°C
Thermal 7
Sky 10
Rain 10
Wind 10
Higher = better, including rain & wind (green = "doesn't hurt the score", not "lots of it").
July 9/10 beach 9/10 urban
feels 27°C
· HCI 94/100
Day 25° · Night 23°
· warm nights (23°)
🌙 30 tropical nights/yr
☀ UV 8.6 (very high)
76% humidity 20 km/h wind 1 rain day (12h) 323h sun
sea 28°C
Thermal 7
Sky 10
Rain 10
Wind 10
Higher = better, including rain & wind (green = "doesn't hurt the score", not "lots of it").
August 9/10 beach 9/10 urban
feels 27°C
(−1°C vs 1991-2020) · HCI 94/100
Day 26° · Night 24°
· warm nights (24°)
🌙 30 tropical nights/yr
73% humidity 22 km/h wind 4 rain days (35h) 296h sun
sea 28°C
Thermal 7
Sky 10
Rain 10
Wind 10
Higher = better, including rain & wind (green = "doesn't hurt the score", not "lots of it").
September 9/10 beach 8/10 urban
feels 23°C
· HCI 85/100
Day 23° · Night 21°
🌙 22 tropical nights/yr
· peak 27 70% humidity 25 km/h wind 9 rain days (89h) 245h sun
sea 25°C
Thermal 8
Sky 9
Rain 8
Wind 9
Higher = better, including rain & wind (green = "doesn't hurt the score", not "lots of it").
October 8/10 beach 8/10 urban
feels 19°C
· HCI 81/100
Day 20° · Night 18°
🌙 4 tropical nights/yr
· peak 17 72% humidity 24 km/h wind 9 rain days (100h) 215h sun
sea 24°C
Thermal 7
Sky 9
Rain 8
Wind 9
Higher = better, including rain & wind (green = "doesn't hurt the score", not "lots of it").
November 5/10 beach 5/10 urban
feels 14°C
(+1°C vs 1991-2020) · HCI 54/100
Day 17° · Night 15°
70% humidity 30 km/h wind 16 rain days (189h) 166h sun
sea 20°C
Thermal 5
Sky 5
Rain 4
Wind 9
Higher = better, including rain & wind (green = "doesn't hurt the score", not "lots of it").
December 5/10 beach 5/10 urban
feels 10°C
(+1°C vs 1991-2020) · HCI 51/100
Day 14° · Night 12°
70% humidity 30 km/h wind 14 rain days (190h) 156h sun
sea 18°C
Thermal 4
Sky 5
Rain 5
Wind 9
Higher = better, including rain & wind (green = "doesn't hurt the score", not "lots of it").
January 1–10 5/10 beach 5/10 urban
feels 9°C
(+1°C vs 1991-2020) · HCI 53/100
Day 13° · Night 11°
73% humidity 29 km/h wind 4 rain days (61h) 49h sun
sea 17°C
Thermal 3
Sky 6
Rain 5
Wind 9
Higher = better, including rain & wind (green = "doesn't hurt the score", not "lots of it").
January 11–20 6/10 beach 5/10 urban
feels 8°C
(+1°C vs 1991-2020) · HCI 61/100
Day 12° · Night 10°
67% humidity 31 km/h wind 4 rain days (47h) 55h sun
sea 17°C
Thermal 3
Sky 7
Rain 6
Wind 9
Higher = better, including rain & wind (green = "doesn't hurt the score", not "lots of it").
January 21–31 6/10 beach 5/10 urban
feels 7°C
· HCI 58/100
Day 12° · Night 9°
68% humidity 30 km/h wind 4 rain days (51h) 65h sun
sea 16°C
Thermal 2
Sky 7
Rain 6
Wind 9
Higher = better, including rain & wind (green = "doesn't hurt the score", not "lots of it").
February 1–10 7/10 beach 6/10 urban
feels 8°C
(+1°C vs 1991-2020) · HCI 71/100
Day 12° · Night 10°
69% humidity 30 km/h wind 3 rain days (34h) 65h sun
sea 15°C
Thermal 2
Sky 9
Rain 7
Wind 9
Higher = better, including rain & wind (green = "doesn't hurt the score", not "lots of it").
February 11–20 7/10 beach 6/10 urban
feels 8°C
(+1°C vs 1991-2020) · HCI 74/100
Day 12° · Night 10°
72% humidity 25 km/h wind 3 rain days (31h) 69h sun
sea 15°C
Thermal 3
Sky 9
Rain 8
Wind 9
Higher = better, including rain & wind (green = "doesn't hurt the score", not "lots of it").
February 21–28 7/10 beach 6/10 urban
feels 8°C
· HCI 75/100
Day 13° · Night 10°
70% humidity 30 km/h wind 2 rain days (24h) 60h sun
sea 15°C
Thermal 3
Sky 9
Rain 9
Wind 9
Higher = better, including rain & wind (green = "doesn't hurt the score", not "lots of it").
March 1–10 5/10 beach 5/10 urban
feels 8°C
· HCI 55/100
Day 12° · Night 10°
69% humidity 29 km/h wind 5 rain days (54h) 71h sun
sea 15°C
Thermal 2
Sky 6
Rain 5
Wind 9
Higher = better, including rain & wind (green = "doesn't hurt the score", not "lots of it").
March 11–20 8/10 beach 6/10 urban
feels 9°C
(−1°C vs 1991-2020) · HCI 76/100
Day 12° · Night 10°
69% humidity 25 km/h wind 3 rain days (29h) 74h sun
sea 15°C
Thermal 3
Sky 9
Rain 8
Wind 9
Higher = better, including rain & wind (green = "doesn't hurt the score", not "lots of it").
March 21–31 8/10 beach 6/10 urban
feels 9°C
(−1°C vs 1991-2020) · HCI 75/100
Day 13° · Night 11°
72% humidity 26 km/h wind 3 rain days (30h) 83h sun
sea 16°C
Thermal 3
Sky 9
Rain 8
Wind 9
Higher = better, including rain & wind (green = "doesn't hurt the score", not "lots of it").
April 1–10 8/10 beach 7/10 urban
feels 9°C
(−3°C vs 1991-2020) · HCI 78/100
Day 13° · Night 10°
70% humidity 27 km/h wind 3 rain days (26h) 82h sun
sea 16°C
Thermal 3
Sky 10
Rain 8
Wind 9
Higher = better, including rain & wind (green = "doesn't hurt the score", not "lots of it").
April 11–20 7/10 beach 6/10 urban
feels 11°C
(−1°C vs 1991-2020) · HCI 74/100
Day 14° · Night 12°
73% humidity 23 km/h wind 3 rain days (35h) 77h sun
sea 17°C
Thermal 4
Sky 9
Rain 7
Wind 9
Higher = better, including rain & wind (green = "doesn't hurt the score", not "lots of it").
April 21–30 8/10 beach 7/10 urban
feels 13°C
(−1°C vs 1991-2020) · HCI 81/100
Day 15° · Night 13°
78% humidity 23 km/h wind 2 rain days (27h) 84h sun
sea 17°C
Thermal 4
Sky 10
Rain 9
Wind 9
Higher = better, including rain & wind (green = "doesn't hurt the score", not "lots of it").
May 1–10 8/10 beach 7/10 urban
feels 14°C
(−2°C vs 1991-2020) · HCI 81/100
Day 16° · Night 14°
79% humidity 22 km/h wind 2 rain days (29h) 84h sun
sea 18°C
Thermal 5
Sky 9
Rain 8
Wind 10
Higher = better, including rain & wind (green = "doesn't hurt the score", not "lots of it").
May 11–20 8/10 beach 7/10 urban
feels 16°C
(−2°C vs 1991-2020) · HCI 80/100
Day 18° · Night 16°
79% humidity 25 km/h wind 3 rain days (30h) 84h sun
sea 19°C
Thermal 5
Sky 9
Rain 8
Wind 9
Higher = better, including rain & wind (green = "doesn't hurt the score", not "lots of it").
May 21–31 9/10 beach 8/10 urban
feels 18°C
(−1°C vs 1991-2020) · HCI 91/100
Day 19° · Night 17°
77% humidity 20 km/h wind 2 rain days (11h) 109h sun
sea 21°C
Thermal 6
Sky 10
Rain 9
Wind 10
Higher = better, including rain & wind (green = "doesn't hurt the score", not "lots of it").
June 1–10 9/10 beach 8/10 urban
feels 20°C
(−1°C vs 1991-2020) · HCI 90/100
Day 20° · Night 18°
🌙 14 tropical nights/yr
· peak 24 79% humidity 21 km/h wind 2 rain days (23h) 95h sun
sea 23°C
Thermal 7
Sky 10
Rain 9
Wind 10
Higher = better, including rain & wind (green = "doesn't hurt the score", not "lots of it").
June 11–20 9/10 beach 9/10 urban
feels 22°C
(−1°C vs 1991-2020) · HCI 94/100
Day 22° · Night 20°
🌙 14 tropical nights/yr
· peak 24 76% humidity 20 km/h wind 1 rain day (13h) 100h sun
sea 24°C
Thermal 7
Sky 10
Rain 10
Wind 10
Higher = better, including rain & wind (green = "doesn't hurt the score", not "lots of it").
June 21–30 9/10 beach 9/10 urban
feels 25°C
· HCI 93/100
Day 24° · Night 21°
🌙 14 tropical nights/yr
· peak 24
☀ UV 8.3 (very high)
79% humidity 19 km/h wind 0 rain days (3h) 103h sun
sea 25°C
Thermal 7
Sky 10
Rain 10
Wind 10
Higher = better, including rain & wind (green = "doesn't hurt the score", not "lots of it").
July 1–10 9/10 beach 9/10 urban
feels 26°C
· HCI 94/100
Day 24° · Night 22°
🌙 30 tropical nights/yr
☀ UV 8.6 (very high)
77% humidity 21 km/h wind 1 rain day (5h) 104h sun
sea 26°C
Thermal 7
Sky 10
Rain 10
Wind 10
Higher = better, including rain & wind (green = "doesn't hurt the score", not "lots of it").
July 11–20 9/10 beach 9/10 urban
feels 27°C
(+1°C vs 1991-2020) · HCI 94/100
Day 25° · Night 23°
· warm nights (23°)
🌙 30 tropical nights/yr
☀ UV 9 (very high)
74% humidity 19 km/h wind 0 rain days (5h) 105h sun
sea 28°C
Thermal 7
Sky 10
Rain 10
Wind 10
Higher = better, including rain & wind (green = "doesn't hurt the score", not "lots of it").
July 21–31 9/10 beach 9/10 urban
feels 28°C
(+1°C vs 1991-2020) · HCI 93/100
Day 26° · Night 24°
· warm nights (24°)
🌙 30 tropical nights/yr
☀ UV 8.3 (very high)
76% humidity 21 km/h wind 0 rain days (1h) 114h sun
sea 28°C
Thermal 7
Sky 10
Rain 10
Wind 10
Higher = better, including rain & wind (green = "doesn't hurt the score", not "lots of it").
August 1–10 9/10 beach 9/10 urban
feels 27°C
(−1°C vs 1991-2020) · HCI 95/100
Day 26° · Night 24°
· warm nights (24°)
🌙 30 tropical nights/yr
☀ UV 8.1 (very high)
72% humidity 22 km/h wind 1 rain day (7h) 100h sun
sea 27°C
Thermal 8
Sky 10
Rain 10
Wind 9
Higher = better, including rain & wind (green = "doesn't hurt the score", not "lots of it").
August 11–20 9/10 beach 9/10 urban
feels 28°C
(+1°C vs 1991-2020) · HCI 92/100
Day 26° · Night 24°
· warm nights (24°)
🌙 30 tropical nights/yr
75% humidity 21 km/h wind 2 rain days (14h) 97h sun
sea 28°C
Thermal 7
Sky 10
Rain 9
Wind 10
Higher = better, including rain & wind (green = "doesn't hurt the score", not "lots of it").
August 21–31 9/10 beach 9/10 urban
feels 27°C
· HCI 94/100
Day 25° · Night 23°
· warm nights (23°)
🌙 30 tropical nights/yr
73% humidity 22 km/h wind 1 rain day (13h) 100h sun
sea 28°C
Thermal 7
Sky 10
Rain 10
Wind 10
Higher = better, including rain & wind (green = "doesn't hurt the score", not "lots of it").
September 1–10 9/10 beach 9/10 urban
feels 25°C
(+1°C vs 1991-2020) · HCI 93/100
Day 25° · Night 22°
🌙 22 tropical nights/yr
· peak 27 69% humidity 23 km/h wind 2 rain days (15h) 85h sun
sea 26°C
Thermal 8
Sky 10
Rain 9
Wind 9
Higher = better, including rain & wind (green = "doesn't hurt the score", not "lots of it").
September 11–20 9/10 beach 9/10 urban
feels 23°C
· HCI 92/100
Day 23° · Night 21°
🌙 22 tropical nights/yr
· peak 27 70% humidity 23 km/h wind 2 rain days (22h) 83h sun
sea 25°C
Thermal 8
Sky 10
Rain 9
Wind 9
Higher = better, including rain & wind (green = "doesn't hurt the score", not "lots of it").
September 21–30 7/10 beach 7/10 urban
feels 21°C
· HCI 67/100
Day 22° · Night 19°
🌙 22 tropical nights/yr
· peak 27 70% humidity 27 km/h wind 5 rain days (52h) 77h sun
sea 25°C
Thermal 8
Sky 7
Rain 5
Wind 9
Higher = better, including rain & wind (green = "doesn't hurt the score", not "lots of it").
October 1–10 8/10 beach 8/10 urban
feels 20°C
· HCI 83/100
Day 21° · Night 19°
🌙 4 tropical nights/yr
· peak 17 70% humidity 25 km/h wind 3 rain days (33h) 73h sun
sea 24°C
Thermal 8
Sky 9
Rain 8
Wind 9
Higher = better, including rain & wind (green = "doesn't hurt the score", not "lots of it").
October 11–20 8/10 beach 8/10 urban
feels 18°C
· HCI 81/100
Day 19° · Night 17°
🌙 4 tropical nights/yr
· peak 17 71% humidity 24 km/h wind 3 rain days (34h) 69h sun
sea 24°C
Thermal 7
Sky 9
Rain 7
Wind 9
Higher = better, including rain & wind (green = "doesn't hurt the score", not "lots of it").
October 21–31 8/10 beach 8/10 urban
feels 18°C
(+1°C vs 1991-2020) · HCI 81/100
Day 19° · Night 17°
🌙 4 tropical nights/yr
· peak 17 74% humidity 23 km/h wind 3 rain days (33h) 73h sun
sea 23°C
Thermal 7
Sky 9
Rain 8
Wind 9
Higher = better, including rain & wind (green = "doesn't hurt the score", not "lots of it").
November 1–10 7/10 beach 7/10 urban
feels 16°C
(+1°C vs 1991-2020) · HCI 67/100
Day 19° · Night 16°
70% humidity 28 km/h wind 4 rain days (49h) 59h sun
sea 22°C
Thermal 6
Sky 7
Rain 6
Wind 9
Higher = better, including rain & wind (green = "doesn't hurt the score", not "lots of it").
November 11–20 6/10 beach 5/10 urban
feels 15°C
(+2°C vs 1991-2020) · HCI 55/100
Day 17° · Night 15°
71% humidity 28 km/h wind 5 rain days (62h) 57h sun
sea 21°C
Thermal 5
Sky 6
Rain 4
Wind 9
Higher = better, including rain & wind (green = "doesn't hurt the score", not "lots of it").
November 21–30 4/10 beach 4/10 urban
feels 11°C
· HCI 39/100
Day 15° · Night 13°
67% humidity 35 km/h wind 6 rain days (78h) 50h sun
sea 19°C
Thermal 4
Sky 4
Rain 3
Wind 8
Higher = better, including rain & wind (green = "doesn't hurt the score", not "lots of it").
December 1–10 2/10 beach 3/10 urban
feels 10°C
· HCI 24/100
Day 14° · Night 12°
70% humidity 35 km/h wind 7 rain days (97h) 44h sun
sea 19°C
Thermal 4
Sky 2
Rain 1
Wind 8
Higher = better, including rain & wind (green = "doesn't hurt the score", not "lots of it").
December 11–20 7/10 beach 6/10 urban
feels 10°C
(+1°C vs 1991-2020) · HCI 69/100
Day 14° · Night 11°
68% humidity 28 km/h wind 3 rain days (38h) 56h sun
sea 18°C
Thermal 4
Sky 8
Rain 7
Wind 9
Higher = better, including rain & wind (green = "doesn't hurt the score", not "lots of it").
December 21–31 6/10 beach 5/10 urban
feels 10°C
(+2°C vs 1991-2020) · HCI 59/100
Day 14° · Night 12°
73% humidity 27 km/h wind 4 rain days (54h) 57h sun
sea 17°C
Thermal 3
Sky 6
Rain 6
Wind 9
Higher = better, including rain & wind (green = "doesn't hurt the score", not "lots of it").
 Private Boat Tour of Capri
 Private Boat Tour of Capri
 Half Day Private Boat Tour of Capri
 Capri Island with a Local Expert Guide
 Private Capri Boat Tour "Local Gems & Prosecco" Best Seller
 2 Hours Guided Sunset Tour of the Island of Capri with Aperitif
 Complete Private Guided Two Hour Tour of the Coast of Capri
 Small Group Capri Island Boat Ride with Swimming and Limoncello
 Capri and Anacapri: Boat Tour, Minibus, Chairlift and Lunch
 Capri: Authentic Pasta Cooking Class, Wine and Sea View