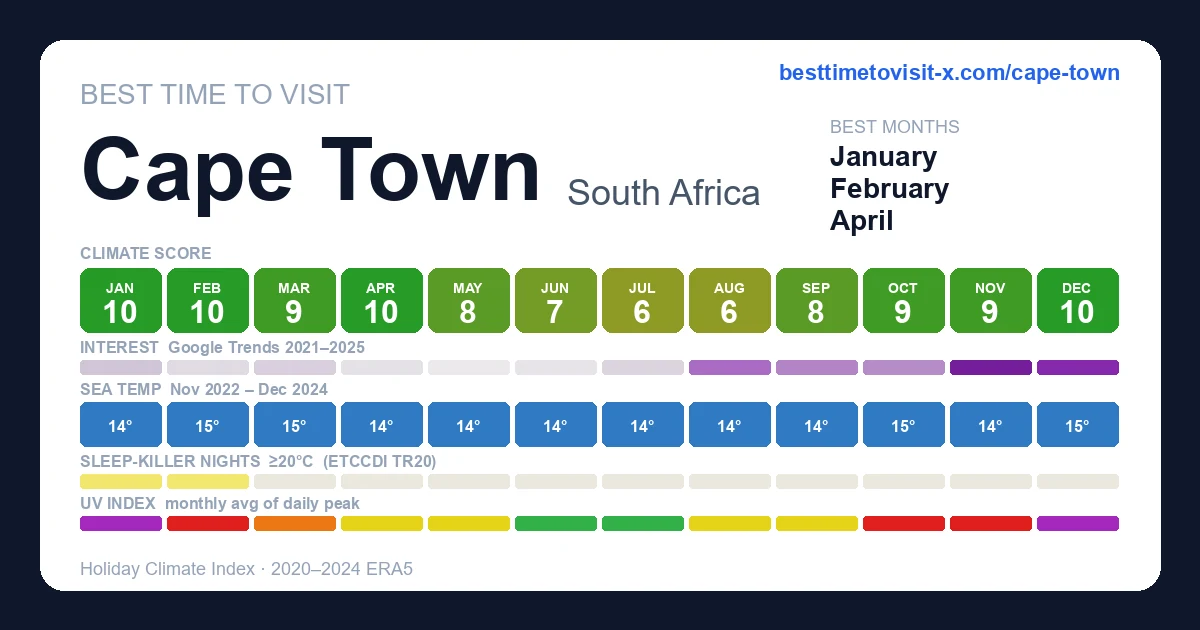
Best time to visit Cape Town
Re-score for me — drag the dial — every chart recolours live for your heat & sea limits 27°C · sea 29°C
Default 27 °C is the upper edge of the Holiday Climate Index "ideal comfort" band (Scott, Rutty, Amelung & Tang, 2016). Above this, most warm-tourism travellers report measurable discomfort.
Default 29 °C is the Beach Climate Index "bathtub" line (Morgan et al.) — where the sea stops being refreshing and starts feeling like a warm bath.
How is this scored? HCI / Steadman / CCI gate — full methodology and citations below.
Compare with another destination
Add as many as you like — stacked below the main strips above. Each row is just the recent-window score strip and (for beach destinations) sea-temperature strip.
Tours in Cape Town
16 top-rated tours via Viator. Booking links earn this site a commission at no cost to you. Map locations are approximate (centred on Cape Town).
- 1
 Table Mountain, Boulders Penguins and Cape point Day Tour
 - 2
 Private Tour: Cape of Good Hope and Cape Point from Cape Town
 - 3
 All-Inclusive Private Tour: Table Mountain, Cape Point & Penguins
 - 4
 Cape Town Airport Private Transfer
 - 5
 Steam Train to Elgin Railway Market
 - 6
 2 Day Safari Experience from Cape Town
 - 7
 Cape Point and Boulder's Penguins Full Day Tour
 - 8
 Private Full Day Stellenbosch Wine Tour with Pick Up and Drop Off
 - 9
 Cape Peninsula Private Tour Include Park Fees
 - 10
 Cape of Good Hope and Boulders Penguins Day Tour from Cape Town
 - 11
 Cape Town Wine Tour: Stellenbosch & Franschhoek +Tastings & Lunch
 - 12
 Wine Tour: Paarl, Franschhoek & Stellenbosch incl 3 wineries
 - 13
 Cape Town: Lion's Head Sunrise/Sunset Hike
 - 14
 African Story Wine Tours in the Cape Winelands
 - 15
 Half Day Boulders Penguins and Cape Point Small Group Tour
 - 16
 Aquila Big 5 Safari + Lunch Buffet + Pick & Drop from CAPE TOWN
Last refreshed 2026-05-25.
Similar climatesPerth93% · Viña del Mar86% · Punta del Este85%
Other destinations with the most-alike year-round climate to Cape Town (apparent temperature, rain hours, sunshine — matched within the same trip-profile). The ±N chip compares each match's typical score for the current month against Cape Town's. Based on the 2020-2024 climatology, not this year's actual weather.
Month-by-month
| Month | Temp °C | Feels °C | Rain days | Rain h | Rain h/day | Humidity | Wind km/h | Sun h | UV | Interest | Score |
|---|---|---|---|---|---|---|---|---|---|---|---|
| Jan | 17–26 | 25 | 3 | 38 | 12.7 | 56% | 26 | 305 | 12 | Quiet | 10 |
| Feb | 17–26 | 25 | 3 | 34 | 11.3 | 55% | 25 | 257 | 10 | Quiet | 10 |
| Mar | 16–24 | 23 | 5 | 69 | 13.8 | 61% | 24 | 248 | 8 | Quiet | 9 |
| Apr | 14–22 | 21 | 5 | 52 | 10.4 | 61% | 22 | 218 | 5 | Quiet | 10 |
| May | 12–19 | 18 | 8 | 101 | 12.6 | 68% | 18 | 199 | 3 | Quiet | 8 |
| Jun | 11–18 | 17 | 11 | 150 | 13.6 | 71% | 21 | 174 | 2 | Quiet | 7 |
| Jul | 10–16 | 14 | 11 | 164 | 14.9 | 71% | 20 | 192 | 2 | Quiet | 6 |
| Aug | 10–16 | 14 | 12 | 160 | 13.3 | 69% | 21 | 206 | 4 | Moderate | 6 |
| Sep | 11–18 | 15 | 8 | 112 | 14.0 | 66% | 22 | 223 | 6 | Moderate | 8 |
| Oct | 13–22 | 20 | 6 | 70 | 11.7 | 58% | 24 | 274 | 8 | Moderate | 9 |
| Nov | 15–23 | 21 | 7 | 71 | 10.1 | 57% | 24 | 278 | 10 | Peak | 9 |
| Dec | 16–24 | 22 | 5 | 61 | 12.2 | 58% | 25 | 301 | 11 | Peak | 10 |
UV Index in Cape Town by Month
UV index in Cape Town peaks at 12 (extreme) in January, dropping to 2 (low) in June. January, February, October, November, December reach very high or extreme levels — apply SPF 50+, wear a hat and protective clothing, and limit direct sun between 11:00 and 17:00.
Best months in detail
January
10/1017–26°C · 3 rain days (38h) · 305 sun hours · 56% humidity · Quiet crowd · UV 12 (extreme)
February
10/1017–26°C (feels 25°C) · 3 rain days (34h) · 257 sun hours · 55% humidity · Quiet crowd · UV 10 (very high) · sunniest 1 in 10 days reach 12 (extreme)
April
10/1014–22°C (feels 21°C) · 5 rain days (52h) · 218 sun hours · 61% humidity · Quiet crowd · UV 5 (moderate) · sunniest 1 in 10 days reach 7 (high)
Every month
Show the other 9 months in detail
March
9/1016–24°C · 5 rain days (69h) · 248 sun hours · 61% humidity · Quiet crowd · UV 8 (high) · sunniest 1 in 10 days reach 10 (very high)
May
8/1012–19°C (feels 18°C) · 8 rain days (101h) · 199 sun hours · 68% humidity · Quiet crowd · UV 3 (moderate)
June
7/1011–18°C (feels 17°C) · 11 rain days (150h) · 174 sun hours · 71% humidity · Quiet crowd · UV 2 (low)
July
6/1010–16°C (feels 14°C) · 11 rain days (164h) · 192 sun hours · 71% humidity · Quiet crowd · UV 2 (low) · sunniest 1 in 10 days reach 3 (moderate)
August
6/1010–16°C (feels 14°C) · 12 rain days (160h) · 206 sun hours · 69% humidity · Moderate crowd · UV 4 (moderate)
September
8/1011–18°C (feels 15°C) · 8 rain days (112h) · 223 sun hours · 66% humidity · Moderate crowd · UV 6 (moderate) · sunniest 1 in 10 days reach 7 (high)
October
9/1013–22°C (feels 20°C) · 6 rain days (70h) · 274 sun hours · 58% humidity · Moderate crowd · UV 8 (very high) · sunniest 1 in 10 days reach 10 (very high)
November
9/1015–23°C (feels 21°C) · 7 rain days (71h) · 278 sun hours · 57% humidity · Peak crowd · UV 10 (very high) · sunniest 1 in 10 days reach 11 (extreme)
December
10/1016–24°C (feels 22°C) · 5 rain days (61h) · 301 sun hours · 58% humidity · Peak crowd · UV 11 (extreme) · sunniest 1 in 10 days reach 13 (extreme)
Comparisons people search for
Pairs validated by Google Autocomplete demand — only pairs people actually compare.
Frequently asked questions about visiting Cape Town
When is the best time to visit Cape Town?
January is the highest-scoring month (10/10 on the Holiday Climate Index). Typical conditions: 17–26°C (3 rainy days). The top three months by score are January, February, April.
What is the worst time to visit Cape Town?
August is the lowest-scoring month (6/10). Typical conditions: 10–16°C (12 rainy days).
When are crowds lowest in Cape Town?
Search-interest seasonality (Google Trends 2021-2025) is lowest in May and peaks in November. Interest tracks both in-trip visitors and lead-time planners, so treat it as a "destination is on people's minds" signal rather than literal arrivals.
Which months in Cape Town have good weather but fewer tourists?
January (climate 10/10, crowd index 20) and February (climate 10/10, crowd index 8) — shoulder months with above-average climate and below-median search-interest. Often the best value-for-weather trade.
What is the UV index in Cape Town by month?
UV peaks at 12 (extreme) in January and is lowest in June at 2 (low). Monthly peak values: Jan 12, Feb 10, Mar 8, Apr 5, May 3, Jun 2, Jul 2, Aug 4, Sep 6, Oct 8, Nov 10, Dec 11. January, February, October, November, December reach very high or extreme levels — apply SPF 50+, wear a hat and protective clothing, and limit direct sun between 11:00 and 17:00.
What is the UV index in Cape Town in January?
January is the peak UV month in Cape Town, with a daily-peak UV index of 12 (extreme). At this level, sunburn can occur in under 20 minutes on unprotected fair skin. Apply SPF 50+, wear protective clothing and a hat, and avoid direct midday sun (11:00–17:00).
How high can UV get in Cape Town on the sunniest days?
Most days look like the monthly average, but on the sunniest ~1 in 10 days UV climbs higher than the mean suggests. December is the worst case: typical days average UV 11 (extreme), but the top 10% of days reach UV 13 (extreme) — and even higher. Months where the sunniest days routinely exceed the typical reading: February, March, April, July, September, October, November, December. Plan sun protection for the worst case, not the average.
Is air quality in Cape Town bad for travelers?
PM2.5 (fine-particle pollution) exceeds the WHO sensitive-group guideline (15 µg/m³) in 12 months: January, February, March, April, May, June, July, August, September, October, November, December. The worst month is May with a typical-day mean of 25 µg/m³ (unhealthy for sensitive); on the worst 10% of days PM2.5 reaches 41 µg/m³ (hazardous) and higher. People with asthma, heart conditions, or sensitive children may want to avoid these months or limit outdoor activity. Source: CAMS via Open-Meteo.