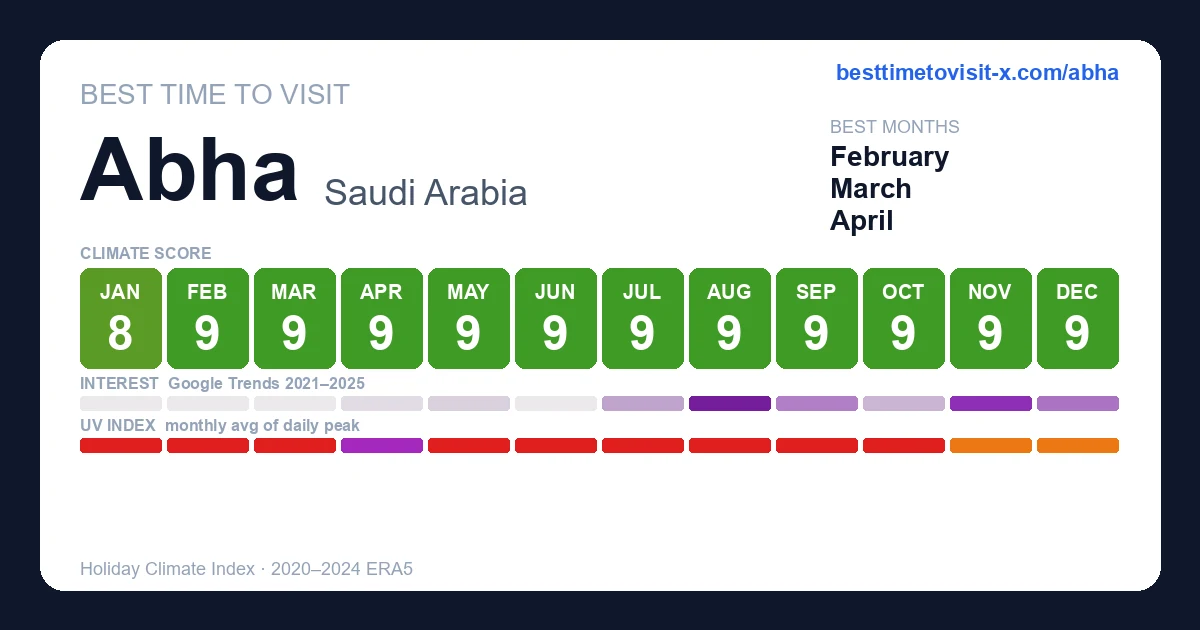
January 8/10
feels 15°C
(−1°C vs 1991-2020) · HCI 82/100
Day 17° · Night 8°
☀ UV 8.2 (very high)
58% humidity 16 km/h wind 5 rain days (77h) 247h sun
Thermal 7
Sky 10
Rain 9
Wind 10
Higher = better, including rain & wind (green = "doesn't hurt the score", not "lots of it").
February 9/10
feels 16°C
(−2°C vs 1991-2020) · HCI 90/100
Day 19° · Night 10°
☀ UV 10.3 (very high)
52% humidity 18 km/h wind 5 rain days (47h) 232h sun
Thermal 8
Sky 10
Rain 9
Wind 10
Higher = better, including rain & wind (green = "doesn't hurt the score", not "lots of it").
March 9/10
feels 18°C
(−1°C vs 1991-2020) · HCI 88/100
Day 20° · Night 12°
☀ UV 10.8 (very high)
49% humidity 18 km/h wind 7 rain days (87h) 261h sun
Thermal 9
Sky 9
Rain 8
Wind 10
Higher = better, including rain & wind (green = "doesn't hurt the score", not "lots of it").
April 9/10
feels 20°C
(−2°C vs 1991-2020) · HCI 89/100
Day 22° · Night 13°
☀ UV 11.6 (extreme)
46% humidity 17 km/h wind 10 rain days (91h) 264h sun
Thermal 9
Sky 9
Rain 8
Wind 10
Higher = better, including rain & wind (green = "doesn't hurt the score", not "lots of it").
May 9/10
feels 23°C
(−1°C vs 1991-2020) · HCI 88/100
Day 25° · Night 16°
· cools 9° at night
☀ UV 10.6 (very high)
38% humidity 16 km/h wind 11 rain days (74h) 268h sun
Thermal 9
Sky 10
Rain 8
Wind 10
Higher = better, including rain & wind (green = "doesn't hurt the score", not "lots of it").
June 9/10
feels 25°C
(−1°C vs 1991-2020) · HCI 86/100
Day 29° · Night 19°
· cools 10° at night
☀ UV 10.6 (very high)
22% humidity 19 km/h wind 5 rain days (30h) 260h sun
Thermal 7
Sky 10
Rain 10
Wind 10
Higher = better, including rain & wind (green = "doesn't hurt the score", not "lots of it").
July 9/10
feels 25°C
(−1°C vs 1991-2020) · HCI 90/100
Day 27° · Night 19°
· cools 8° at night
☀ UV 10.3 (very high)
34% humidity 17 km/h wind 7 rain days (58h) 238h sun
Thermal 8
Sky 10
Rain 9
Wind 10
Higher = better, including rain & wind (green = "doesn't hurt the score", not "lots of it").
August 9/10
feels 25°C
· HCI 86/100
Day 26° · Night 18°
· cools 8° at night
☀ UV 8.9 (very high)
44% humidity 16 km/h wind 14 rain days (94h) 246h sun
Thermal 9
Sky 9
Rain 7
Wind 10
Higher = better, including rain & wind (green = "doesn't hurt the score", not "lots of it").
September 9/10
feels 24°C
· HCI 88/100
Day 27° · Night 17°
· cools 10° at night
☀ UV 10 (very high)
25% humidity 20 km/h wind 5 rain days (30h) 255h sun
Thermal 7
Sky 10
Rain 10
Wind 10
Higher = better, including rain & wind (green = "doesn't hurt the score", not "lots of it").
October 9/10
feels 20°C
(−1°C vs 1991-2020) · HCI 89/100
Day 24° · Night 13°
☀ UV 9.5 (very high)
26% humidity 19 km/h wind 3 rain days (30h) 260h sun
Thermal 7
Sky 10
Rain 10
Wind 10
Higher = better, including rain & wind (green = "doesn't hurt the score", not "lots of it").
November 9/10
feels 19°C
· HCI 93/100
Day 21° · Night 11°
44% humidity 13 km/h wind 5 rain days (49h) 239h sun
Thermal 9
Sky 10
Rain 9
Wind 10
Higher = better, including rain & wind (green = "doesn't hurt the score", not "lots of it").
December 9/10
feels 16°C
(−1°C vs 1991-2020) · HCI 90/100
Day 19° · Night 9°
47% humidity 14 km/h wind 2 rain days (36h) 243h sun
Thermal 8
Sky 10
Rain 10
Wind 10
Higher = better, including rain & wind (green = "doesn't hurt the score", not "lots of it").
January 1–10 7/10
feels 15°C
(−1°C vs 1991-2020) · HCI 71/100
Day 17° · Night 9°
63% humidity 16 km/h wind 3 rain days (41h) 77h sun
Thermal 6
Sky 8
Rain 7
Wind 10
Higher = better, including rain & wind (green = "doesn't hurt the score", not "lots of it").
January 11–20 9/10
feels 15°C
(−1°C vs 1991-2020) · HCI 85/100
Day 17° · Night 8°
57% humidity 15 km/h wind 1 rain day (19h) 81h sun
Thermal 7
Sky 10
Rain 10
Wind 10
Higher = better, including rain & wind (green = "doesn't hurt the score", not "lots of it").
January 21–31 9/10
feels 15°C
(−1°C vs 1991-2020) · HCI 87/100
Day 17° · Night 8°
☀ UV 8.7 (very high)
54% humidity 17 km/h wind 1 rain day (17h) 89h sun
Thermal 7
Sky 10
Rain 10
Wind 10
Higher = better, including rain & wind (green = "doesn't hurt the score", not "lots of it").
February 1–10 9/10
feels 16°C
(−1°C vs 1991-2020) · HCI 88/100
Day 18° · Night 9°
☀ UV 9.4 (very high)
56% humidity 18 km/h wind 1 rain day (17h) 82h sun
Thermal 7
Sky 10
Rain 10
Wind 10
Higher = better, including rain & wind (green = "doesn't hurt the score", not "lots of it").
February 11–20 9/10
feels 16°C
(−2°C vs 1991-2020) · HCI 88/100
Day 19° · Night 10°
☀ UV 10.3 (very high)
53% humidity 18 km/h wind 2 rain days (22h) 81h sun
Thermal 8
Sky 10
Rain 9
Wind 10
Higher = better, including rain & wind (green = "doesn't hurt the score", not "lots of it").
February 21–28 9/10
feels 17°C
(−2°C vs 1991-2020) · HCI 91/100
Day 20° · Night 11°
☀ UV 11.3 (extreme)
47% humidity 18 km/h wind 2 rain days (8h) 70h sun
Thermal 8
Sky 10
Rain 9
Wind 10
Higher = better, including rain & wind (green = "doesn't hurt the score", not "lots of it").
March 1–10 9/10
feels 18°C
(−1°C vs 1991-2020) · HCI 94/100
Day 21° · Night 12°
☀ UV 10.5 (very high)
45% humidity 17 km/h wind 1 rain day (14h) 84h sun
Thermal 9
Sky 10
Rain 10
Wind 10
Higher = better, including rain & wind (green = "doesn't hurt the score", not "lots of it").
March 11–20 8/10
feels 18°C
(−1°C vs 1991-2020) · HCI 83/100
Day 20° · Night 12°
☀ UV 10.7 (very high)
54% humidity 18 km/h wind 3 rain days (38h) 82h sun
Thermal 9
Sky 8
Rain 7
Wind 10
Higher = better, including rain & wind (green = "doesn't hurt the score", not "lots of it").
March 21–31 8/10
feels 18°C
(−2°C vs 1991-2020) · HCI 84/100
Day 20° · Night 12°
☀ UV 11.1 (extreme)
50% humidity 19 km/h wind 3 rain days (35h) 94h sun
Thermal 9
Sky 9
Rain 7
Wind 10
Higher = better, including rain & wind (green = "doesn't hurt the score", not "lots of it").
April 1–10 9/10
feels 20°C
(−1°C vs 1991-2020) · HCI 92/100
Day 22° · Night 13°
☀ UV 11.4 (extreme)
42% humidity 18 km/h wind 2 rain days (22h) 89h sun
Thermal 9
Sky 10
Rain 9
Wind 10
Higher = better, including rain & wind (green = "doesn't hurt the score", not "lots of it").
April 11–20 9/10
feels 20°C
(−2°C vs 1991-2020) · HCI 91/100
Day 22° · Night 14°
☀ UV 12.1 (extreme)
48% humidity 18 km/h wind 3 rain days (28h) 87h sun
Thermal 10
Sky 9
Rain 8
Wind 10
Higher = better, including rain & wind (green = "doesn't hurt the score", not "lots of it").
April 21–30 8/10
feels 20°C
(−2°C vs 1991-2020) · HCI 80/100
Day 21° · Night 13°
☀ UV 11.3 (extreme)
49% humidity 17 km/h wind 6 rain days (42h) 88h sun
Thermal 10
Sky 8
Rain 5
Wind 10
Higher = better, including rain & wind (green = "doesn't hurt the score", not "lots of it").
May 1–10 9/10
feels 22°C
(−1°C vs 1991-2020) · HCI 87/100
Day 23° · Night 15°
☀ UV 11.1 (extreme)
50% humidity 15 km/h wind 5 rain days (32h) 86h sun
Thermal 10
Sky 9
Rain 7
Wind 10
Higher = better, including rain & wind (green = "doesn't hurt the score", not "lots of it").
May 11–20 9/10
feels 23°C
(−1°C vs 1991-2020) · HCI 88/100
Day 26° · Night 17°
· cools 9° at night
☀ UV 10.5 (very high)
33% humidity 17 km/h wind 3 rain days (18h) 87h sun
Thermal 8
Sky 10
Rain 9
Wind 10
Higher = better, including rain & wind (green = "doesn't hurt the score", not "lots of it").
May 21–31 9/10
feels 24°C
(−1°C vs 1991-2020) · HCI 85/100
Day 26° · Night 17°
· cools 9° at night
☀ UV 10.2 (very high)
32% humidity 16 km/h wind 4 rain days (23h) 95h sun
Thermal 8
Sky 10
Rain 8
Wind 10
Higher = better, including rain & wind (green = "doesn't hurt the score", not "lots of it").
June 1–10 9/10
feels 25°C
(−1°C vs 1991-2020) · HCI 88/100
Day 28° · Night 18°
· cools 10° at night
☀ UV 10.2 (very high)
23% humidity 20 km/h wind 1 rain day (10h) 87h sun
Thermal 7
Sky 10
Rain 10
Wind 10
Higher = better, including rain & wind (green = "doesn't hurt the score", not "lots of it").
June 11–20 9/10
feels 25°C
(−1°C vs 1991-2020) · HCI 87/100
Day 29° · Night 20°
· cools 9° at night
☀ UV 10.8 (very high)
21% humidity 19 km/h wind 1 rain day (10h) 85h sun
Thermal 7
Sky 10
Rain 10
Wind 10
Higher = better, including rain & wind (green = "doesn't hurt the score", not "lots of it").
June 21–30 8/10
feels 26°C
· HCI 84/100
Day 29° · Night 19°
· cools 10° at night
☀ UV 10.9 (very high)
22% humidity 18 km/h wind 3 rain days (11h) 87h sun
Thermal 7
Sky 10
Rain 9
Wind 10
Higher = better, including rain & wind (green = "doesn't hurt the score", not "lots of it").
July 1–10 9/10
feels 25°C
(−1°C vs 1991-2020) · HCI 89/100
Day 28° · Night 19°
· cools 9° at night
☀ UV 10.9 (very high)
26% humidity 17 km/h wind 1 rain day (10h) 82h sun
Thermal 7
Sky 10
Rain 10
Wind 10
Higher = better, including rain & wind (green = "doesn't hurt the score", not "lots of it").
July 11–20 9/10
feels 25°C
(−1°C vs 1991-2020) · HCI 88/100
Day 27° · Night 19°
· cools 8° at night
☀ UV 10 (very high)
30% humidity 18 km/h wind 2 rain days (19h) 74h sun
Thermal 8
Sky 10
Rain 9
Wind 10
Higher = better, including rain & wind (green = "doesn't hurt the score", not "lots of it").
July 21–31 9/10
feels 25°C
· HCI 89/100
Day 26° · Night 18°
· cools 8° at night
☀ UV 10.1 (very high)
46% humidity 16 km/h wind 4 rain days (29h) 83h sun
Thermal 10
Sky 9
Rain 7
Wind 10
Higher = better, including rain & wind (green = "doesn't hurt the score", not "lots of it").
August 1–10 8/10
feels 24°C
(−1°C vs 1991-2020) · HCI 83/100
Day 25° · Night 18°
☀ UV 9.5 (very high)
52% humidity 14 km/h wind 5 rain days (39h) 76h sun
Thermal 10
Sky 8
Rain 6
Wind 10
Higher = better, including rain & wind (green = "doesn't hurt the score", not "lots of it").
August 11–20 9/10
feels 26°C
· HCI 90/100
Day 26° · Night 18°
· cools 8° at night
☀ UV 8.5 (very high)
45% humidity 15 km/h wind 4 rain days (26h) 82h sun
Thermal 9
Sky 10
Rain 8
Wind 10
Higher = better, including rain & wind (green = "doesn't hurt the score", not "lots of it").
August 21–31 8/10
feels 25°C
· HCI 83/100
Day 27° · Night 18°
· cools 9° at night
☀ UV 8.9 (very high)
36% humidity 18 km/h wind 5 rain days (29h) 89h sun
Thermal 8
Sky 9
Rain 7
Wind 10
Higher = better, including rain & wind (green = "doesn't hurt the score", not "lots of it").
September 1–10 9/10
feels 24°C
(−1°C vs 1991-2020) · HCI 86/100
Day 27° · Night 18°
· cools 9° at night
☀ UV 10 (very high)
27% humidity 19 km/h wind 3 rain days (12h) 86h sun
Thermal 7
Sky 10
Rain 9
Wind 10
Higher = better, including rain & wind (green = "doesn't hurt the score", not "lots of it").
September 11–20 9/10
feels 24°C
· HCI 88/100
Day 27° · Night 18°
· cools 9° at night
☀ UV 9.4 (very high)
26% humidity 18 km/h wind 2 rain days (13h) 84h sun
Thermal 7
Sky 10
Rain 9
Wind 10
Higher = better, including rain & wind (green = "doesn't hurt the score", not "lots of it").
September 21–30 9/10
feels 23°C
· HCI 87/100
Day 27° · Night 16°
· cools 11° at night
☀ UV 10.5 (very high)
21% humidity 22 km/h wind 1 rain day (6h) 86h sun
Thermal 7
Sky 10
Rain 10
Wind 10
Higher = better, including rain & wind (green = "doesn't hurt the score", not "lots of it").
October 1–10 9/10
feels 21°C
(−1°C vs 1991-2020) · HCI 87/100
Day 26° · Night 15°
· cools 11° at night
☀ UV 10.1 (very high)
22% humidity 22 km/h wind 1 rain day (8h) 88h sun
Thermal 7
Sky 10
Rain 10
Wind 10
Higher = better, including rain & wind (green = "doesn't hurt the score", not "lots of it").
October 11–20 9/10
feels 20°C
(−1°C vs 1991-2020) · HCI 86/100
Day 24° · Night 13°
☀ UV 9.8 (very high)
19% humidity 19 km/h wind 0 rain days (2h) 86h sun
Thermal 7
Sky 10
Rain 10
Wind 10
Higher = better, including rain & wind (green = "doesn't hurt the score", not "lots of it").
October 21–31 9/10
feels 20°C
· HCI 90/100
Day 22° · Night 12°
☀ UV 8.6 (very high)
36% humidity 16 km/h wind 2 rain days (20h) 86h sun
Thermal 8
Sky 10
Rain 9
Wind 10
Higher = better, including rain & wind (green = "doesn't hurt the score", not "lots of it").
November 1–10 9/10
feels 19°C
· HCI 89/100
Day 21° · Night 12°
☀ UV 8.3 (very high)
43% humidity 13 km/h wind 3 rain days (20h) 79h sun
Thermal 9
Sky 10
Rain 8
Wind 10
Higher = better, including rain & wind (green = "doesn't hurt the score", not "lots of it").
November 11–20 9/10
feels 19°C
(+1°C vs 1991-2020) · HCI 95/100
Day 21° · Night 11°
44% humidity 13 km/h wind 1 rain day (13h) 80h sun
Thermal 9
Sky 10
Rain 10
Wind 10
Higher = better, including rain & wind (green = "doesn't hurt the score", not "lots of it").
November 21–30 9/10
feels 18°C
· HCI 93/100
Day 20° · Night 11°
44% humidity 14 km/h wind 1 rain day (16h) 79h sun
Thermal 8
Sky 10
Rain 10
Wind 10
Higher = better, including rain & wind (green = "doesn't hurt the score", not "lots of it").
December 1–10 9/10
feels 17°C
· HCI 90/100
Day 20° · Night 10°
40% humidity 14 km/h wind 0 rain days (7h) 78h sun
Thermal 7
Sky 10
Rain 10
Wind 10
Higher = better, including rain & wind (green = "doesn't hurt the score", not "lots of it").
December 11–20 9/10
feels 16°C
(−1°C vs 1991-2020) · HCI 88/100
Day 18° · Night 8°
42% humidity 13 km/h wind 1 rain day (6h) 79h sun
Thermal 7
Sky 10
Rain 10
Wind 10
Higher = better, including rain & wind (green = "doesn't hurt the score", not "lots of it").
December 21–31 9/10
feels 16°C
(−1°C vs 1991-2020) · HCI 86/100
Day 18° · Night 9°
57% humidity 16 km/h wind 1 rain day (24h) 86h sun
Thermal 7
Sky 10
Rain 9
Wind 10
Higher = better, including rain & wind (green = "doesn't hurt the score", not "lots of it").